Printable Gantt Chart Template For Software Development
Printable Gantt Chart Template for Software Development
A Gantt chart is a visual project management tool that provides a clear timeline of tasks, dependencies, and deadlines. It’s invaluable for software development, helping teams organize complex projects, track progress, and ensure on-time delivery. While numerous digital Gantt chart tools exist, a printable template offers a simple, accessible, and often more flexible alternative, especially for smaller teams or individual developers.
Benefits of Using a Printable Gantt Chart Template
* **Accessibility and Simplicity:** Printable templates require no specialized software or internet access. They are readily available and easy to understand, even for those unfamiliar with complex project management tools. * **Cost-Effective:** Unlike subscription-based software, printable templates are free or available at a very low cost. This makes them ideal for budget-conscious teams or individual developers. * **Flexibility and Customization:** Printable templates can be easily adapted to suit specific project needs. You can manually adjust task durations, dependencies, and milestones directly on the chart. * **Enhanced Collaboration:** Physical charts can be posted in a common workspace, providing a visual focal point for team discussions and progress updates. Everyone can see the big picture and contribute to the planning process. * **Reduced Distractions:** Working with a physical chart eliminates the distractions of notifications and other digital interruptions that can plague digital project management tools. * **Tangible Progress Tracking:** Physically marking completed tasks on a chart provides a satisfying sense of accomplishment and reinforces the team’s progress. * **Offline Usability:** Printable charts are not dependent on internet connectivity, making them perfect for situations where access is limited or unreliable.
Key Elements of a Software Development Gantt Chart
A well-designed Gantt chart for software development includes the following key elements: * **Task List:** A comprehensive list of all tasks required to complete the project. This should include tasks such as requirements gathering, design, coding, testing, deployment, and documentation. * **Start and End Dates:** Clear start and end dates for each task, defining the project timeline. * **Task Duration:** The estimated time required to complete each task, typically expressed in days, weeks, or months. * **Dependencies:** Relationships between tasks, indicating which tasks must be completed before others can begin. Arrows or connecting lines are often used to visualize dependencies. * **Milestones:** Significant checkpoints in the project timeline, such as the completion of a major feature or the release of a beta version. * **Resources:** The individuals or teams responsible for completing each task. * **Progress Tracking:** A visual representation of the progress made on each task, often indicated by shading or color-coding.
Creating Your Printable Gantt Chart Template
You can either download a pre-made template or create your own. Here’s how to create one using common spreadsheet software like Microsoft Excel or Google Sheets: 1. **Open a New Spreadsheet:** Start with a blank spreadsheet. 2. **Set Up Headers:** In the first row, enter the following headers: “Task Name,” “Start Date,” “End Date,” “Duration,” “Assigned To,” and “Notes.” You might also add “Dependencies” if needed. 3. **Enter Task Information:** List all the tasks required for your software development project in the “Task Name” column. For each task, enter the corresponding start date, end date, duration, and assigned resource. 4. **Calculate Duration:** In the “Duration” column, use a formula to calculate the duration of each task based on its start and end dates. For example, in Excel, you can use the formula `=End Date – Start Date + 1`. Format the column to display the duration in days. 5. **Create the Chart:** Select the data you entered (excluding the headers). Go to the “Insert” tab and choose “Bar Chart” -> “Stacked Bar.” 6. **Format the Chart:** * Right-click on the first series in the chart (representing the start dates) and choose “Format Data Series.” Set the “Fill” to “No Fill” and the “Border” to “No Line.” This will make the chart display bars representing the task durations starting at the correct dates. * Adjust the horizontal axis to display the project timeline correctly. You may need to set the minimum and maximum values to correspond to the overall project start and end dates. Format the axis to display dates clearly. * Customize the chart title and axis labels to be informative and easy to understand. * Add gridlines and adjust the colors to improve readability. 7. **Add Dependencies (Optional):** You can visually represent dependencies by drawing arrows connecting related tasks on the printed chart. 8. **Print the Chart:** Adjust the chart size and orientation to fit your paper size. Print the chart and use it to track progress.
Tips for Effective Use
* **Keep it Simple:** Avoid overcomplicating the chart with too much detail. Focus on the essential tasks and dependencies. * **Regularly Update:** Review and update the chart regularly to reflect changes in progress, deadlines, or resource availability. * **Communicate Changes:** Communicate any changes to the project timeline or task assignments to the entire team. * **Use Color-Coding:** Use different colors to highlight different task types, project phases, or resource assignments. * **Laminate:** Consider laminating the chart to protect it from wear and tear, allowing you to use dry-erase markers for updates. * **Combine with Digital Tools:** Use the printable chart as a complement to digital project management tools for enhanced collaboration and communication. A printable Gantt chart template provides a simple and effective way to manage software development projects, especially for smaller teams or individual developers. By carefully planning the tasks, dependencies, and milestones, and by regularly updating the chart, you can stay on track and deliver successful software projects on time and within budget.
 2500×1875 gantt chart templates excel powerpoint word templatelab from templatelab.com
 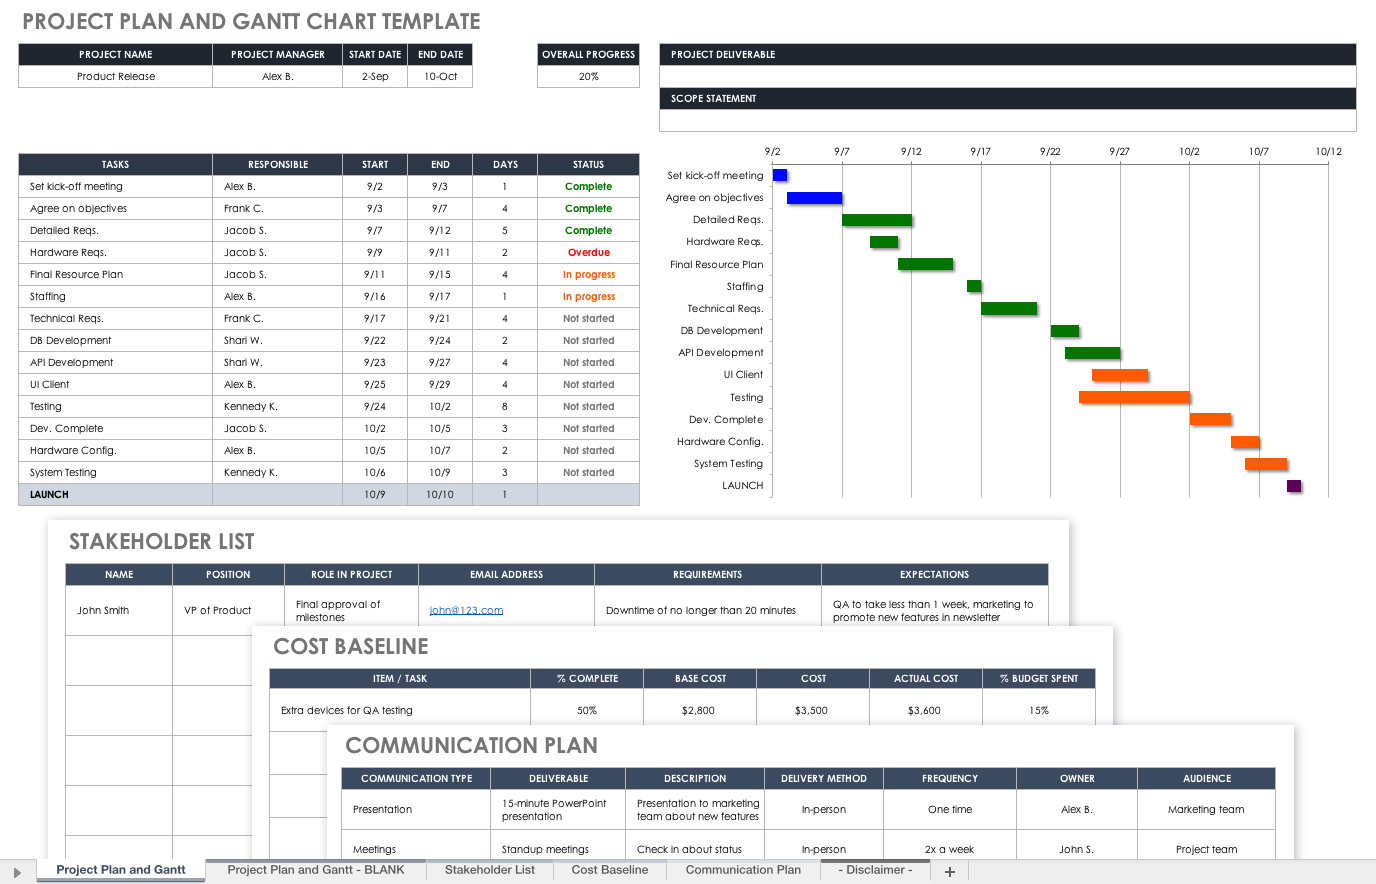 1376×884 gantt chart template software development spreadshee from db-excel.com
  650×335 gantt chart examples templates from www.edrawsoft.com
 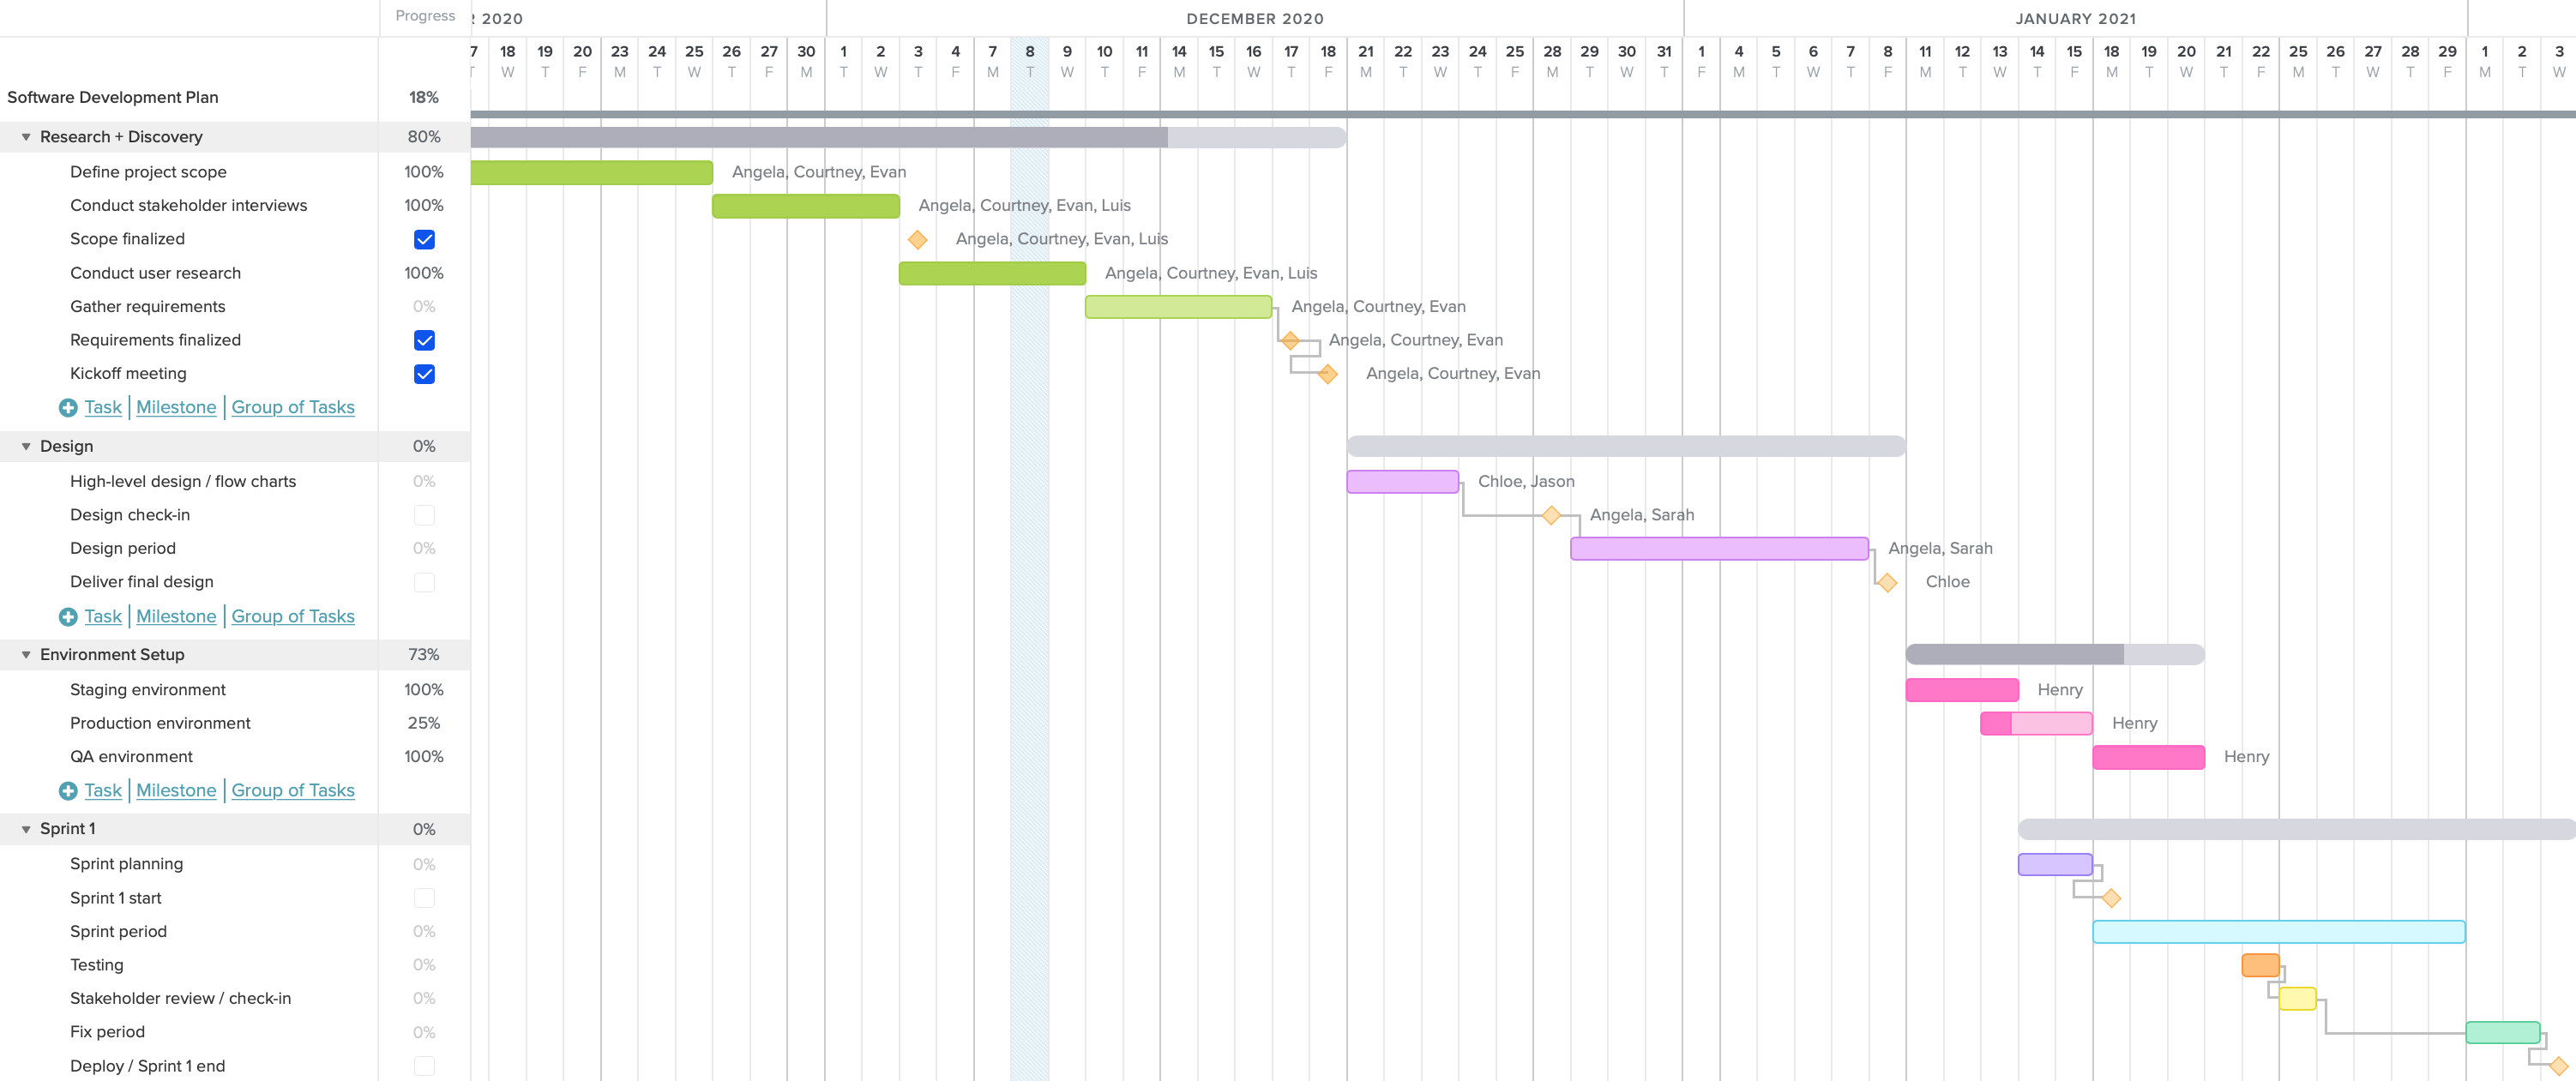 3004×1261 gantt chart examples project management teamgantt from www.teamgantt.com
  1598×860 gantt chart template software development db excelcom from db-excel.com
  1920×926 started gantt chart software from technologyadvice.com
  1908×896 project management gantt chart teamgantt from www.teamgantt.com
  1366×901 gantt chart templates ms word smartshee from www.smartsheet.com
  1248×680 gantt chart excel template from www.smartsheet.com
 Thank you for visiting Printable Gantt Chart Template For Software Development. There are a lot of beautiful templates out there, but it can be easy to feel like a lot of the best cost a ridiculous amount of money, require special design. And if at this time you are looking for information and ideas regarding the Printable Gantt Chart Template For Software Development then, you are in the perfect place. Get this Printable Gantt Chart Template For Software Development for free here. We hope this post Printable Gantt Chart Template For Software Development inspired you and help you what you are looking for.
Printable Gantt Chart Template For Software Development was posted in June 21, 2025 at 3:00 pm. If you wanna have it as yours, please click the Pictures and you will go to click right mouse then Save Image As and Click Save and download the Printable Gantt Chart Template For Software Development Picture.. Don’t forget to share this picture with others via Facebook, Twitter, Pinterest or other social medias! we do hope you'll get inspired by SampleTemplates123... Thanks again! If you have any DMCA issues on this post, please contact us!