Excel Gantt Chart Template For Software Development
Excel Gantt Chart Template for Software Development
Managing software development projects can be a complex undertaking, juggling multiple tasks, deadlines, and resources. A Gantt chart serves as a powerful visual tool to streamline project management, providing a clear overview of timelines and dependencies. While sophisticated project management software exists, Excel remains a readily accessible and versatile option for creating effective Gantt charts, especially for smaller teams or projects.
Understanding the Basics of a Gantt Chart
A Gantt chart is essentially a horizontal bar chart that represents a project schedule. Each bar represents a task or activity, with its length corresponding to the task’s duration. The chart visually displays:
* Tasks: The specific activities required to complete the project. * Start and End Dates: When each task is scheduled to begin and finish. * Duration: The estimated time it takes to complete each task. * Dependencies: Relationships between tasks, indicating which tasks must be completed before others can start. * Milestones: Significant checkpoints or deliverables within the project. * Progress: The percentage of completion for each task. * Resources: Who is assigned to each task.
Why Use Excel for a Gantt Chart?
While specialized project management software offers advanced features, Excel offers several advantages:
* Accessibility: Most professionals already have access to Microsoft Excel. * Familiarity: Many are already comfortable using Excel’s interface and functions. * Cost-Effective: No additional software purchase is required. * Customization: Excel’s flexible nature allows for tailoring the chart to specific project needs. * Ease of Use (for smaller projects): Simple projects can be managed effectively without the complexity of larger software solutions.
Creating a Software Development Gantt Chart in Excel
You can create a Gantt chart in Excel using a template or by building one from scratch. A template provides a pre-designed structure, saving time and effort. Here’s how to use a template, and what key elements should be in it, tailored for software development:
Key Elements of a Software Development Gantt Chart Template:
- Task Breakdown: A clear list of all tasks required for the project. These might include requirements gathering, design, coding, testing (unit, integration, system, user acceptance), deployment, and documentation. Subtasks should be clearly nested under their parent tasks.
- Start and End Dates: Columns to specify the planned start and end dates for each task. Format these columns as dates.
- Duration: A column to calculate the duration of each task in days (or hours, depending on the project scale). This can be calculated automatically using the formula: `=End Date – Start Date`.
- Dependencies: A column to indicate the preceding task(s) that must be completed before the current task can begin. Use task numbers or names for clarity.
- Assigned Resource: A column to identify the team member responsible for each task.
- Progress (%) : A column to track the percentage of completion for each task.
- Milestones: Designate key project milestones, such as code freeze, beta release, or final deployment. Represent milestones visually in the chart.
Building the Chart:
- Data Input: Populate the spreadsheet with your project’s tasks, start dates, end dates, dependencies, assigned resources, and progress.
- Conditional Formatting: Use conditional formatting to visually represent task progress on the Gantt chart. For example, color-code tasks based on their completion percentage.
- Creating the Bar Chart: Select the range of data that includes task names, start dates, and durations. Insert a stacked bar chart. The first series will represent the start date, and the second series will represent the duration.
- Formatting the Chart:
- Format the start date series to have no fill and no border. This will effectively hide it and shift the duration bars to the correct starting position.
- Customize the colors of the duration bars to represent different task types or statuses (e.g., blue for coding, green for testing).
- Add labels to the bars to display task names or progress percentages.
- Adjust the axis scales to display the project timeline appropriately.
- Add gridlines for enhanced readability.
- Adding Dependencies: While Excel’s native chart features don’t directly support dependency lines, you can add arrows manually using the “Insert” tab -> “Shapes”. Position the arrows to connect dependent tasks. Consider using a more visual approach for dependency representation in larger, more complex projects.
Tips for Effective Use
* Keep it Simple: Avoid overcomplicating the chart with excessive details. Focus on the most critical tasks and milestones. * Regularly Update: The Gantt chart is a dynamic tool. Update it regularly to reflect the current project status. * Communicate Effectively: Use the Gantt chart to communicate project progress and timelines to stakeholders. * Use Color Coding: Use color coding to highlight different task types, statuses, or priorities. * Consider Alternatives for Complex Projects: For very large and complex software development projects, dedicated project management software may offer more advanced features and scalability.
In conclusion, an Excel Gantt chart template is a practical and accessible tool for managing software development projects, particularly for smaller teams. By understanding the fundamentals of Gantt charts and customizing a template to suit your specific project needs, you can effectively visualize timelines, track progress, and ensure successful project completion.
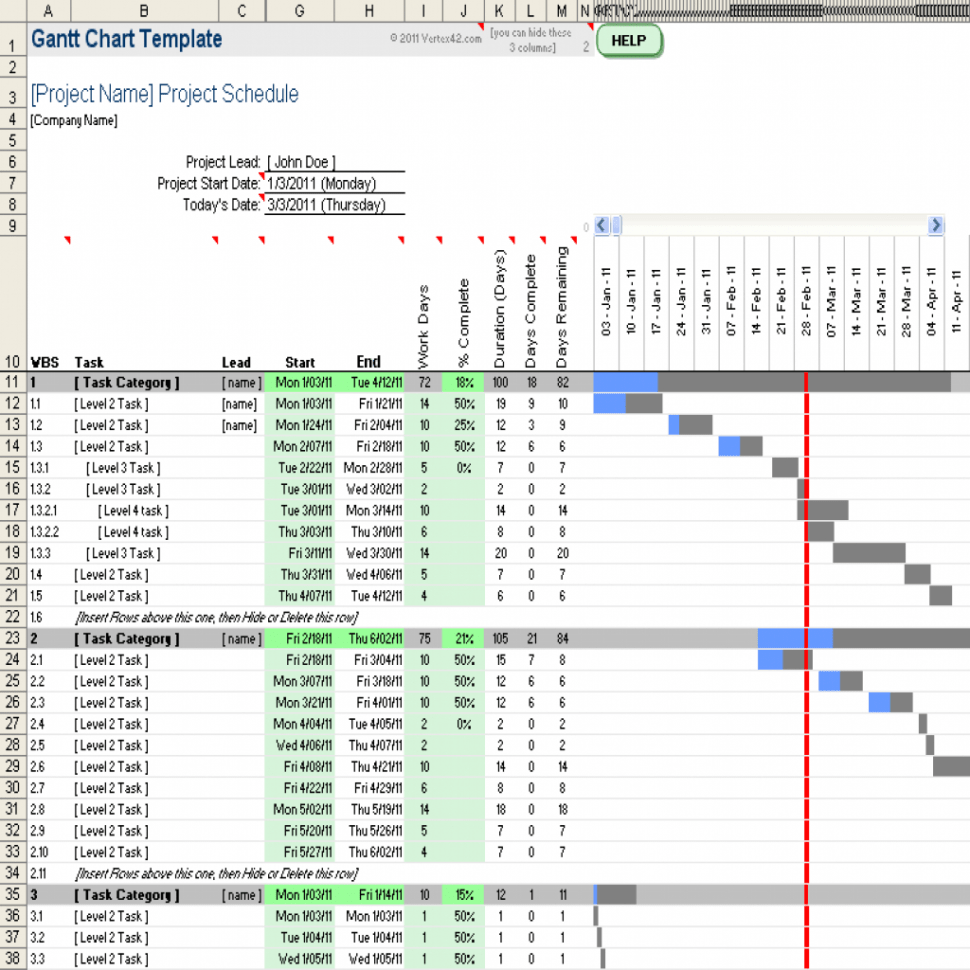 970×970 excel gantt chart chart design gantt chart template pro db from db-excel.com
  1024×768 gantt chart excel template db excelcom from db-excel.com
  1908×896 gantt chart template software development spreadshee from db-excel.com
 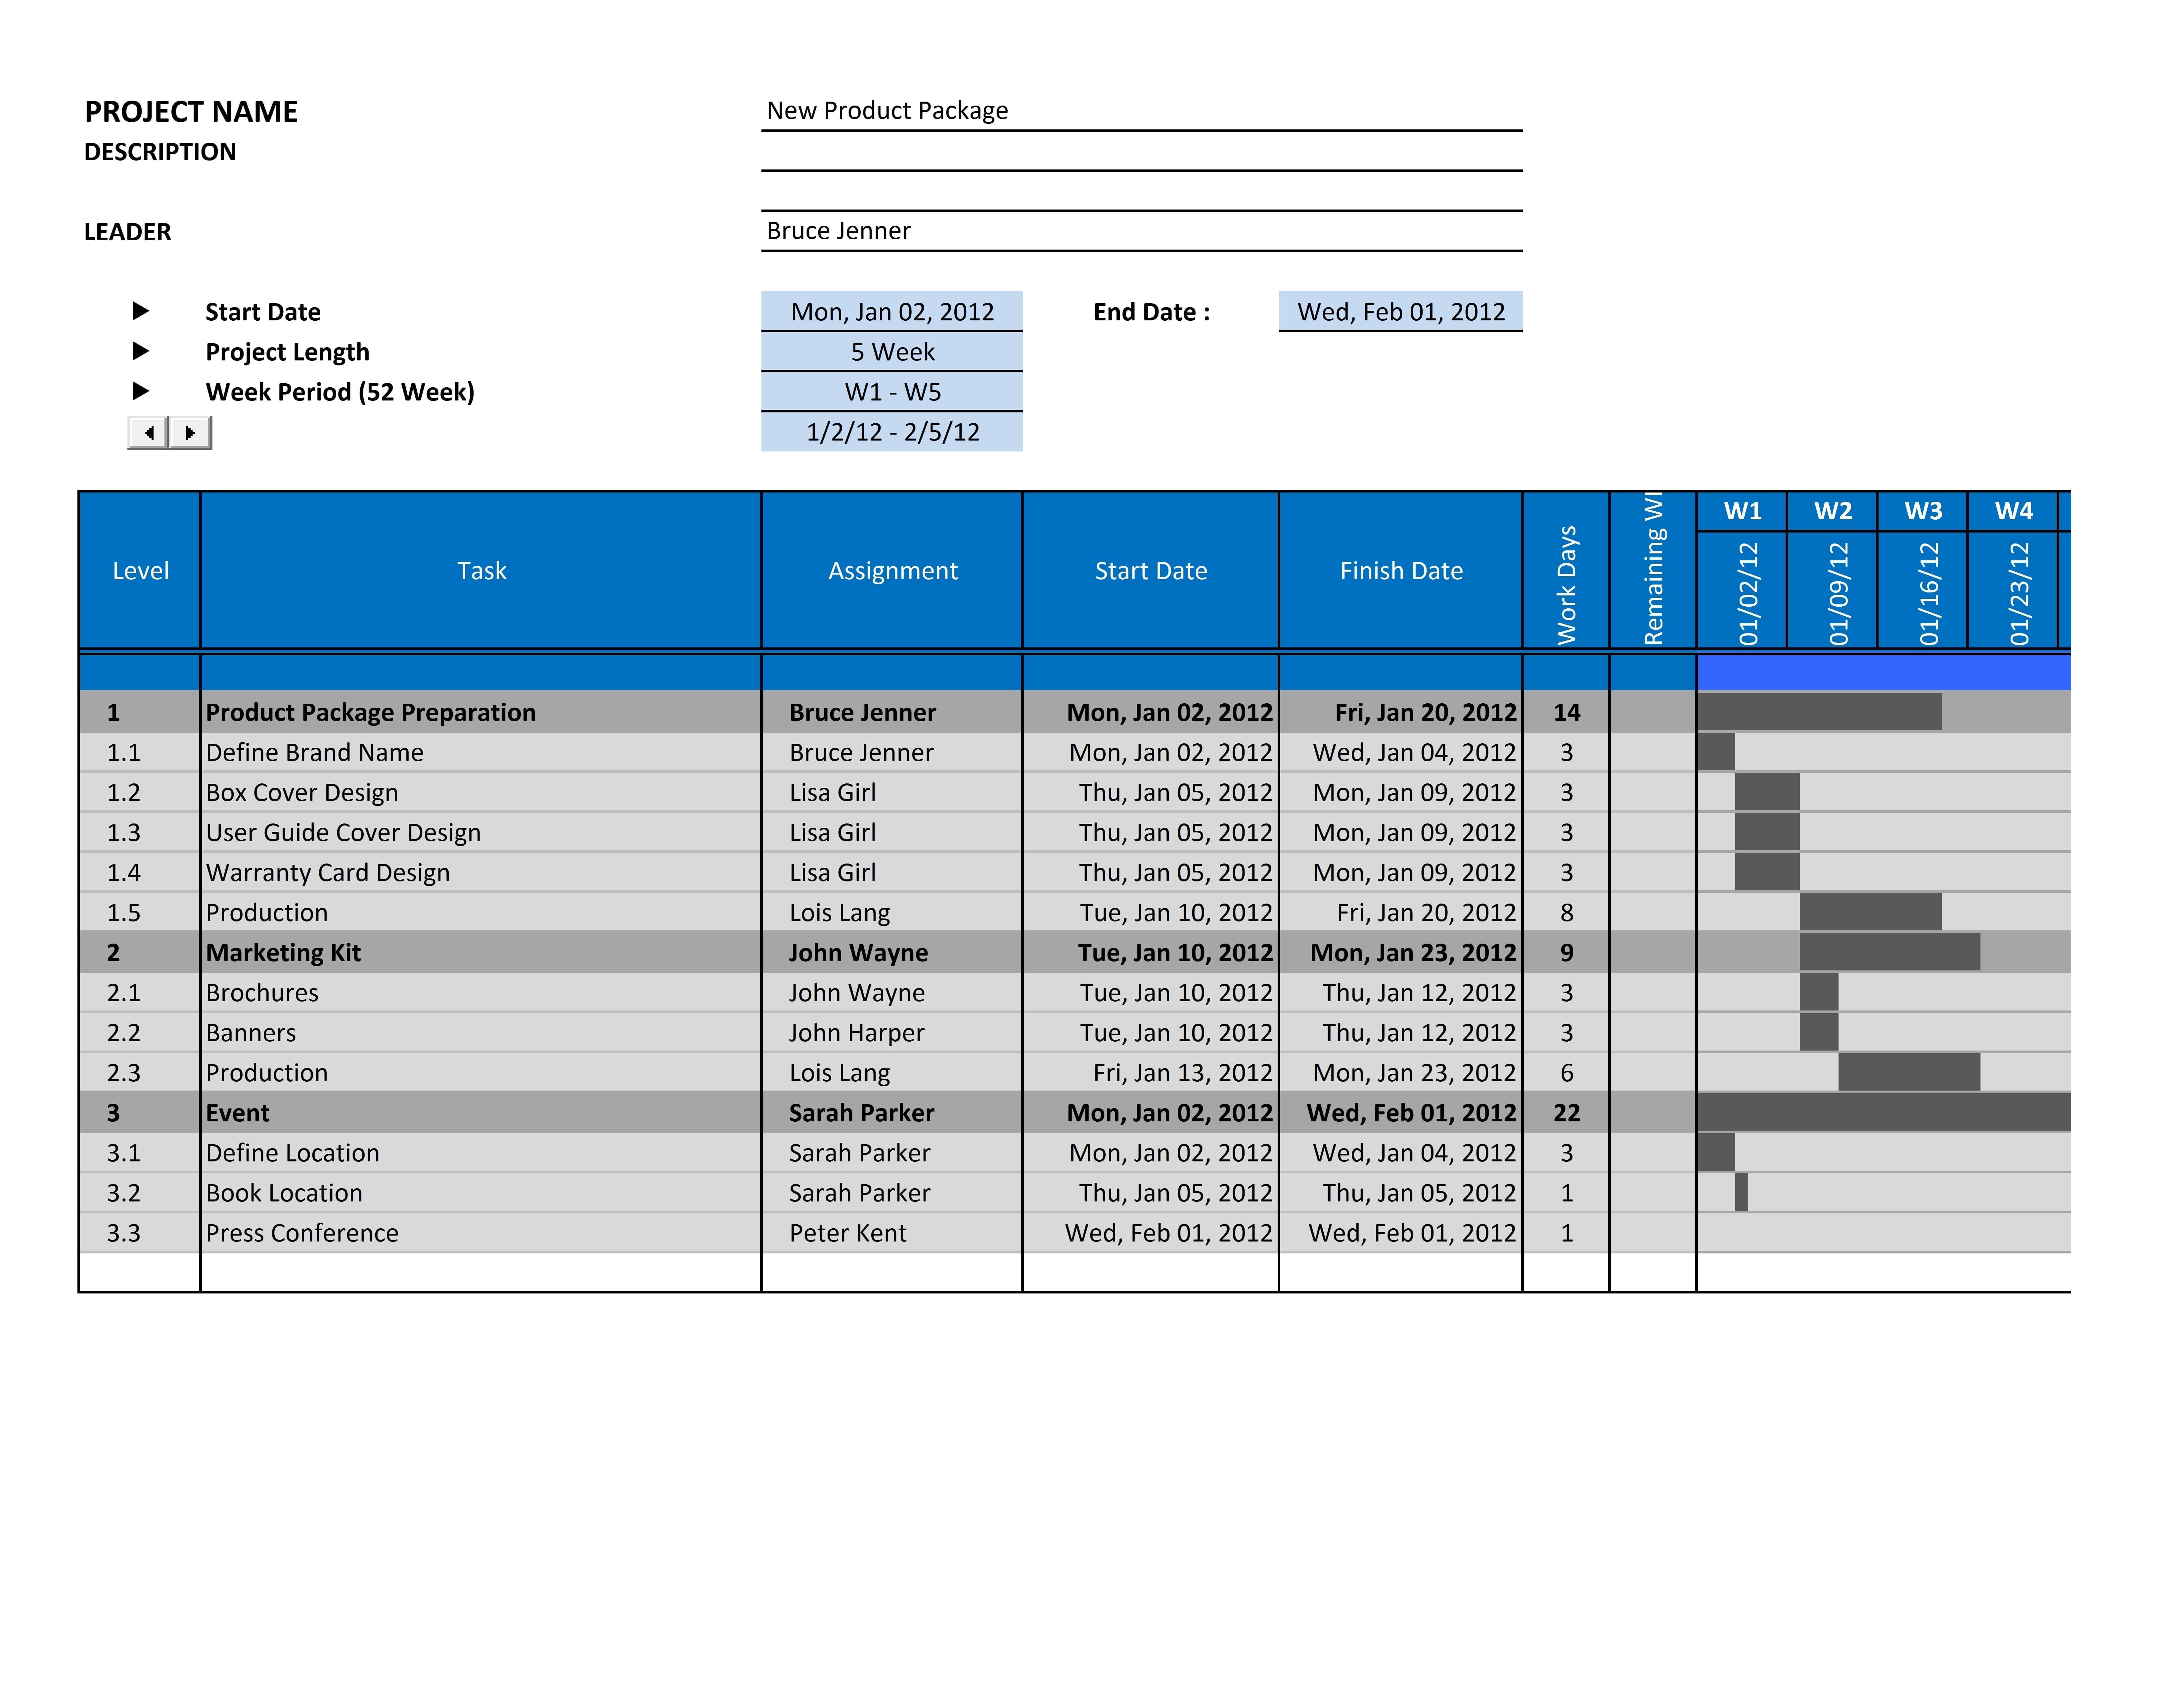 6600×5100 excel spreadsheet gantt chart template excelxocom from excelxo.com
  622×458 excel gantt chart template software from sobolsoft.com
  1194×479 excel gantt chart template features project planning template from www.template124.com
 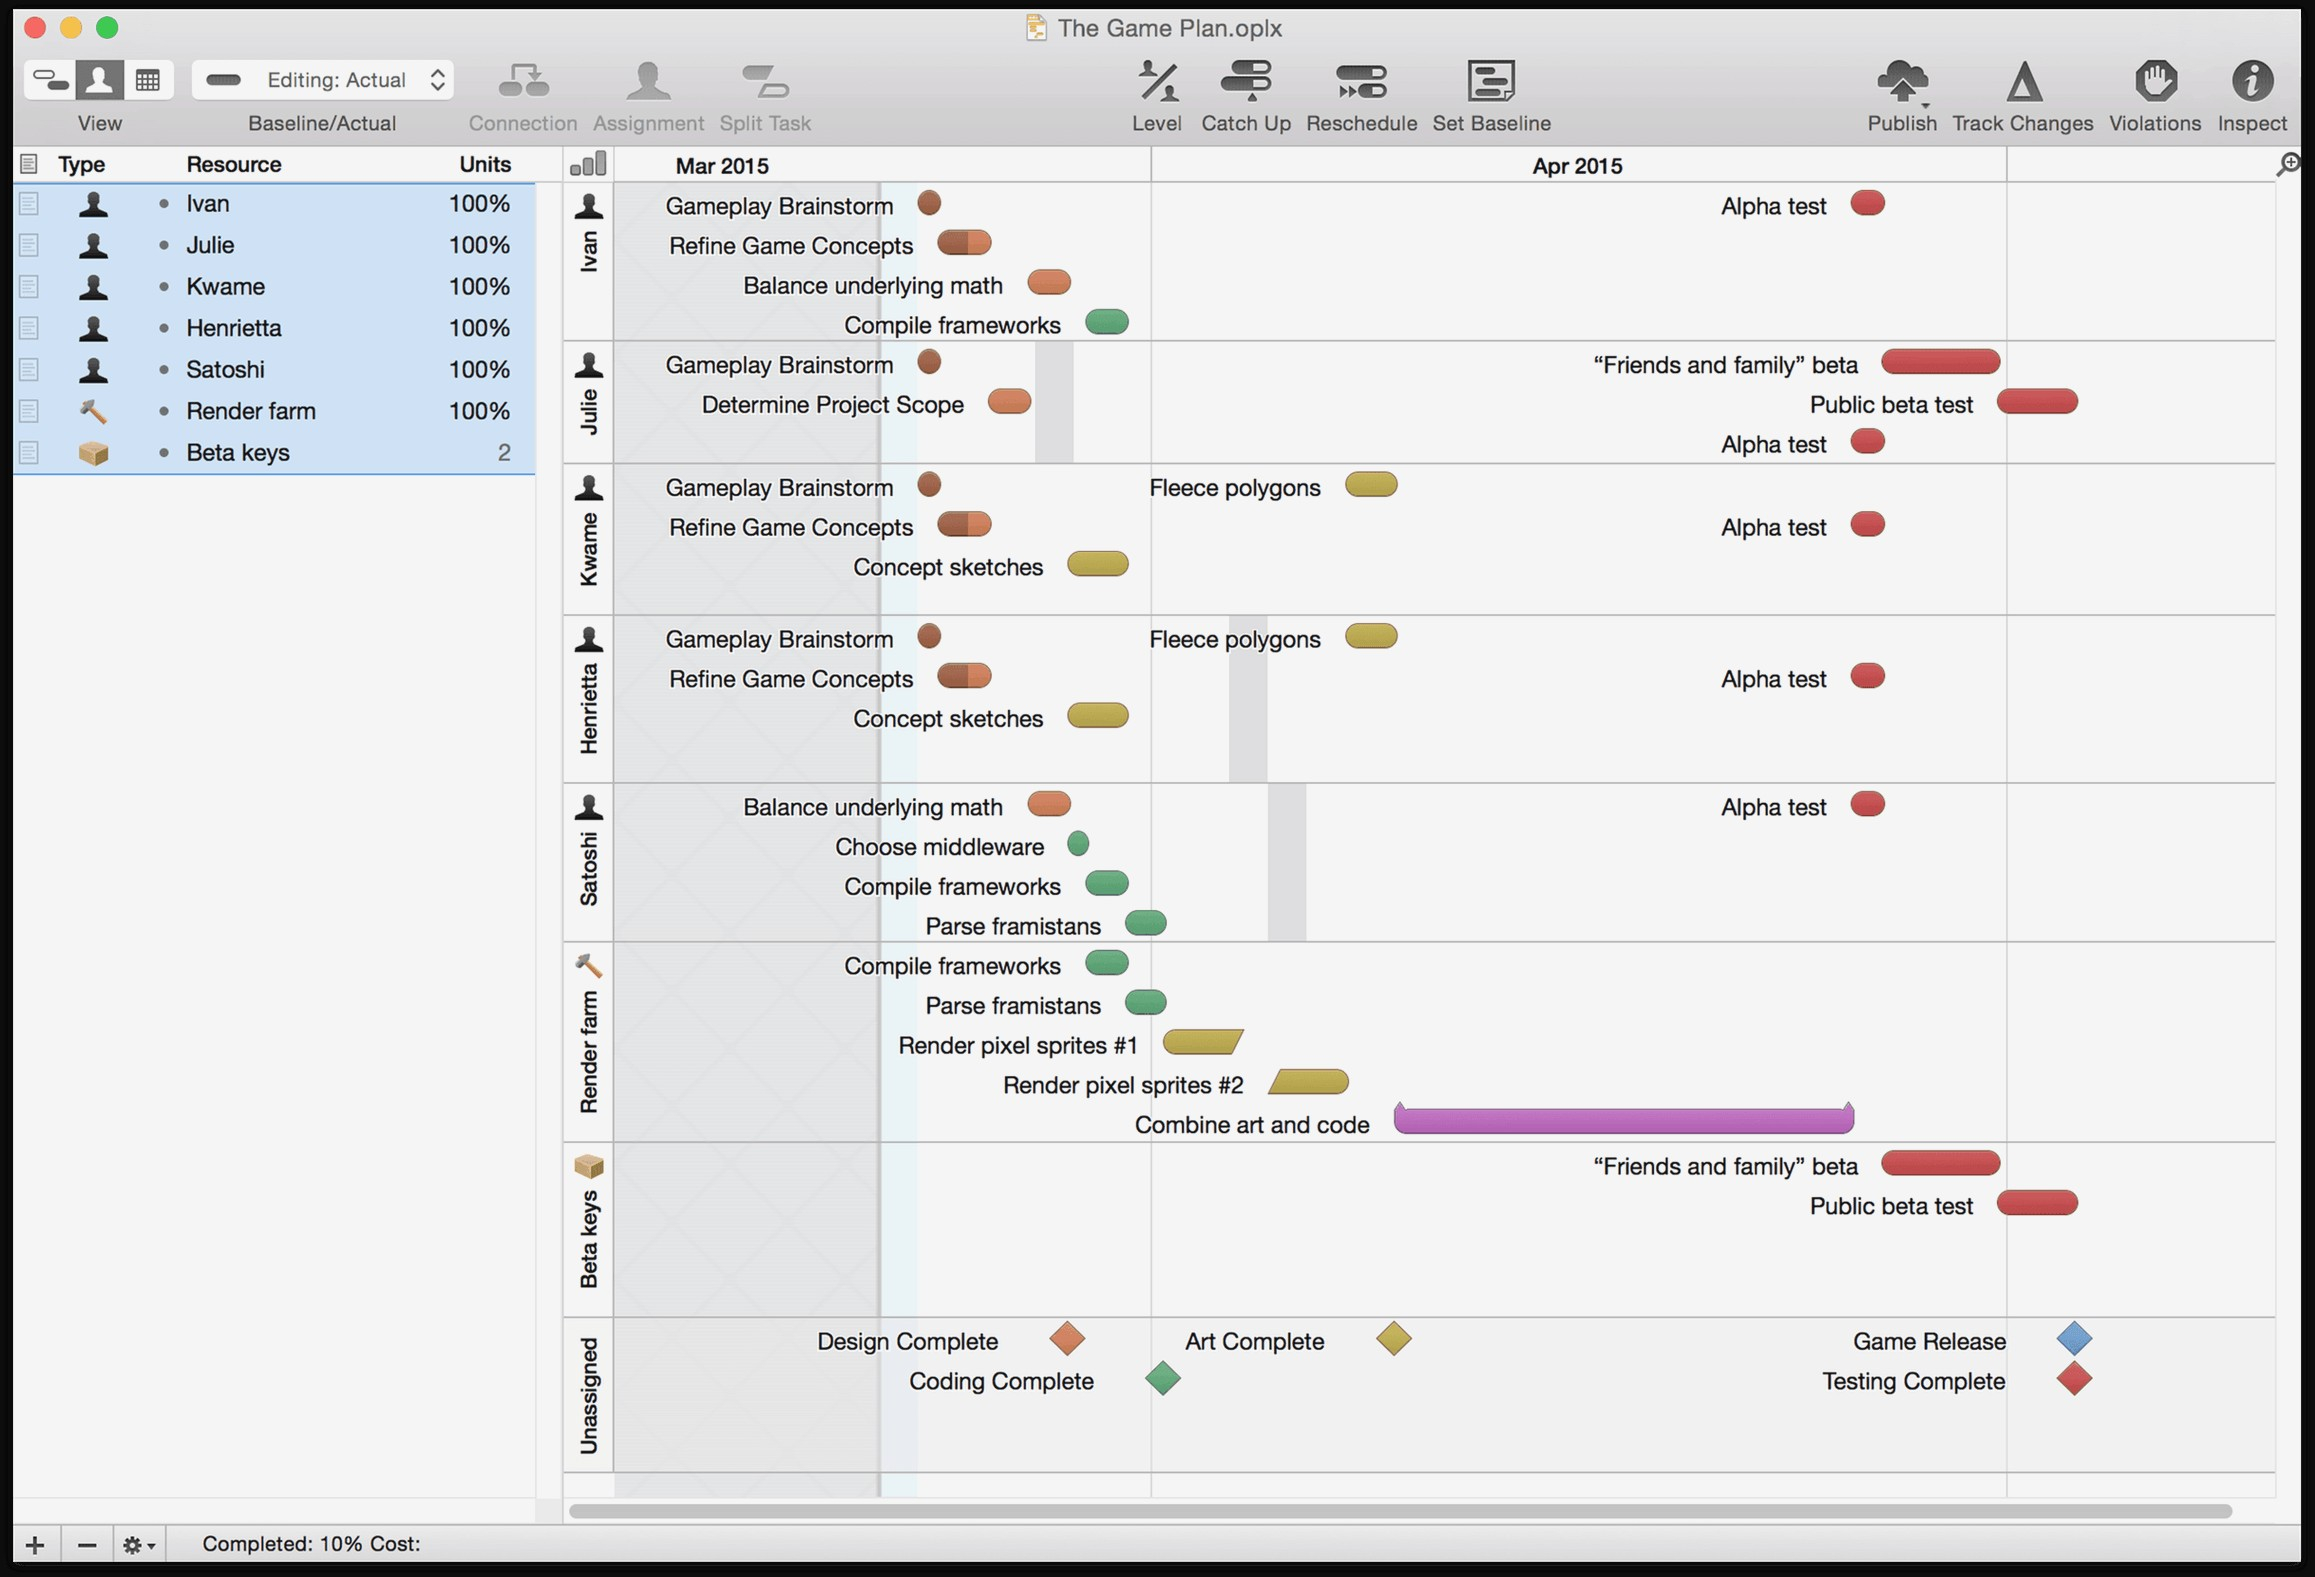 2315×1577 gantt chart template excel mac db excelcom from db-excel.com
 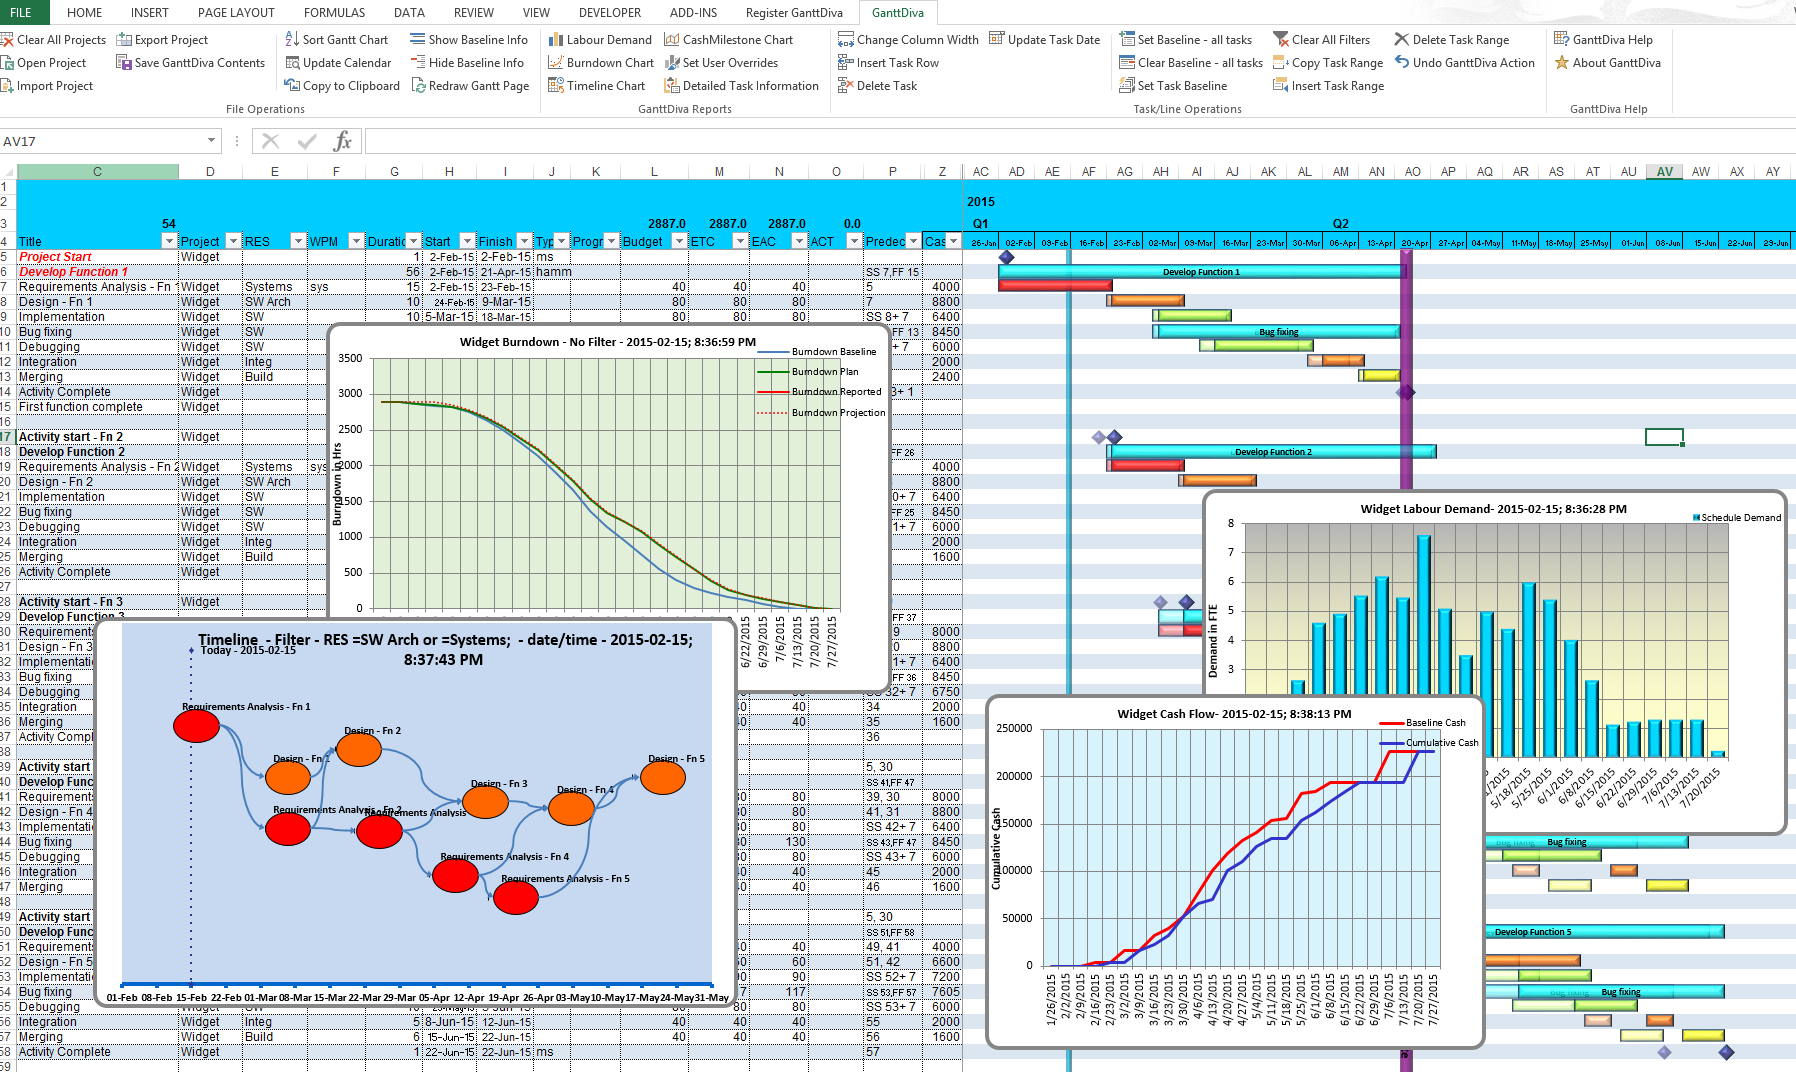 1796×1072 excel gantt chart template dependencies db excelcom from db-excel.com
  1248×680 gantt chart template excel spreadshee gantt from db-excel.com
 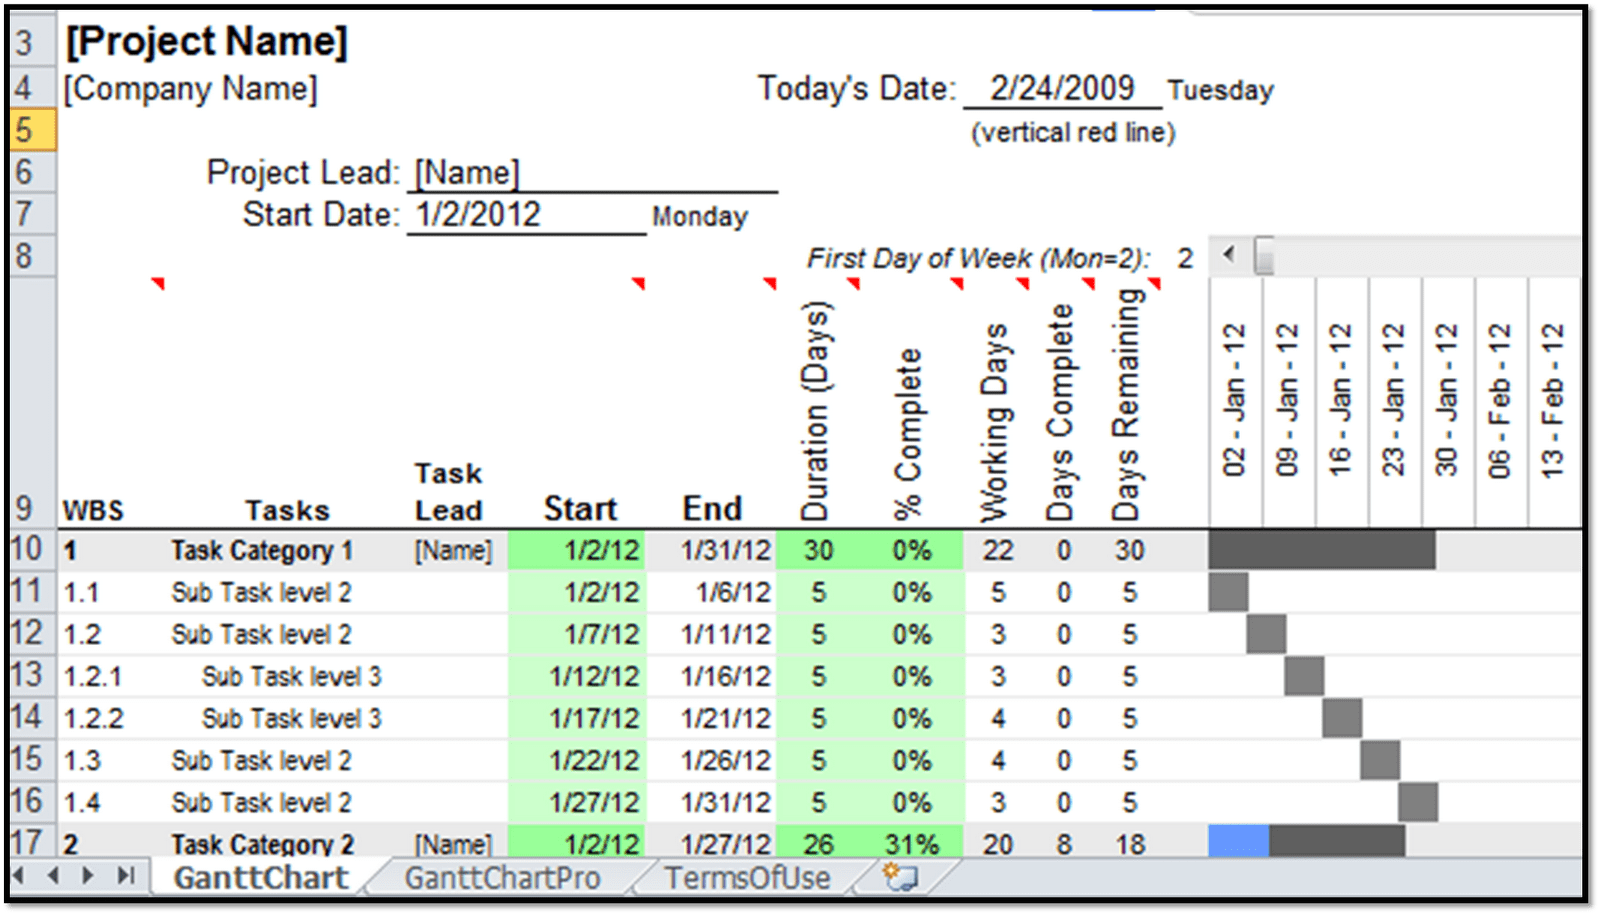 1600×915 gantt chart excel format excel templates from exceltemplate77.blogspot.com
 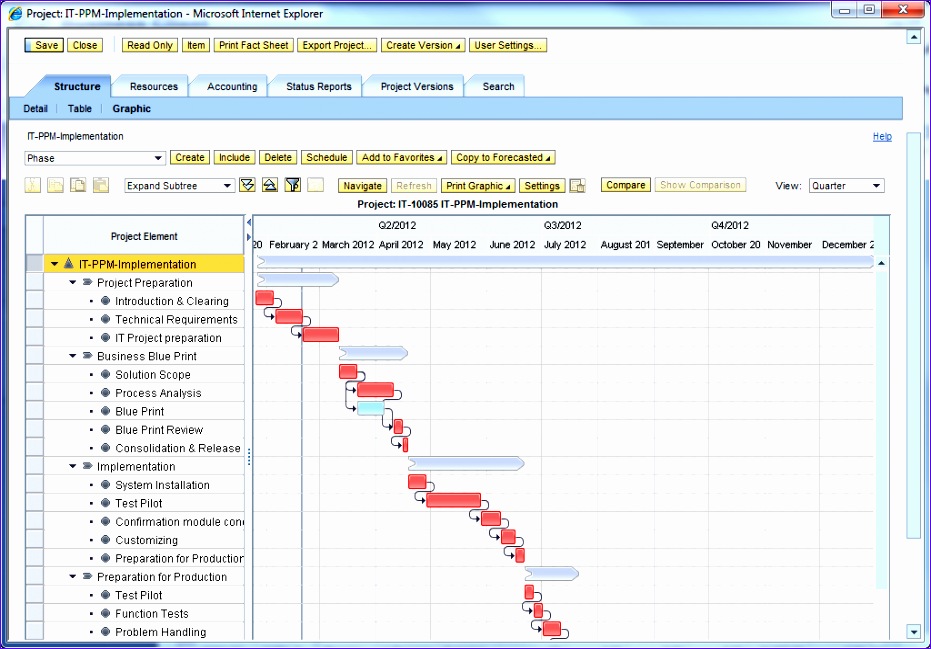 931×649 ms excel gantt chart template excel templates from www.exceltemplate123.us
 Thank you for visiting Excel Gantt Chart Template For Software Development. There are a lot of beautiful templates out there, but it can be easy to feel like a lot of the best cost a ridiculous amount of money, require special design. And if at this time you are looking for information and ideas regarding the Excel Gantt Chart Template For Software Development then, you are in the perfect place. Get this Excel Gantt Chart Template For Software Development for free here. We hope this post Excel Gantt Chart Template For Software Development inspired you and help you what you are looking for.
Excel Gantt Chart Template For Software Development was posted in June 29, 2025 at 9:51 pm. If you wanna have it as yours, please click the Pictures and you will go to click right mouse then Save Image As and Click Save and download the Excel Gantt Chart Template For Software Development Picture.. Don’t forget to share this picture with others via Facebook, Twitter, Pinterest or other social medias! we do hope you'll get inspired by SampleTemplates123... Thanks again! If you have any DMCA issues on this post, please contact us!