Excel Gantt Chart Template With Dependencies
Excel Gantt Chart Template with Dependencies: A Comprehensive Guide
Managing projects effectively requires clear visualization of tasks, timelines, and dependencies. A Gantt chart provides this visual overview, allowing project managers and teams to track progress, identify potential bottlenecks, and ensure projects stay on schedule. While dedicated project management software offers advanced features, Microsoft Excel provides a readily accessible and customizable solution for creating Gantt charts, especially when incorporating task dependencies.
Understanding Gantt Charts and Dependencies
A Gantt chart is a horizontal bar chart that visually represents a project schedule. Each task is depicted as a bar, with the length of the bar corresponding to the task’s duration. The chart displays start and end dates, making it easy to see the overall project timeline and the progress of individual tasks.
Dependencies are relationships between tasks where the start or completion of one task is dependent on the start or completion of another. Common dependency types include:
- Finish-to-Start (FS): Task B cannot start until Task A is finished. (Most common)
- Start-to-Start (SS): Task B cannot start until Task A starts.
- Finish-to-Finish (FF): Task B cannot finish until Task A finishes.
- Start-to-Finish (SF): Task B cannot finish until Task A starts. (Least common)
Incorporating dependencies into an Excel Gantt chart allows you to visually represent these relationships and automatically adjust task schedules if changes occur, ensuring that dependent tasks are shifted accordingly.
Creating a Gantt Chart Template in Excel with Dependencies
Here’s a step-by-step guide to building a Gantt chart template in Excel that handles dependencies:
- Set up your data table: Create a table with the following columns:
- Task Name: The name of the task.
- Start Date: The date the task is scheduled to begin.
- Duration (Days): The number of days the task is expected to take.
- End Date: (Calculated) The date the task is scheduled to end. This will be calculated using a formula.
- Predecessor: (Optional but Crucial for Dependencies) The task number (row number) that this task depends on. Leave blank if there are no predecessors.
- Calculate End Dates: In the “End Date” column, use the following formula (assuming Start Date is in column B and Duration in days is in column C): `=B2+C2-1` (Apply this to all relevant rows). The “-1” is there because the start date itself counts as day one.
- Implement Dependencies (Using Formulas): This is the core of dependency management. We will modify the Start Date calculation. Assuming the Predecessor column is column E, use this formula in the Start Date Column (column B), starting at the *second* row (B2): `=IF(ISBLANK(E2),B2,(INDEX(D:D,E2)+1))`
- Explanation: This formula checks if the “Predecessor” cell (E2) is blank.
- If it is blank (no predecessor), it uses the manually entered Start Date (B2).
- If it’s *not* blank, it uses the `INDEX` function to look up the “End Date” of the predecessor task (specified in column E) and adds 1 day. `INDEX(D:D,E2)` effectively gets the End Date of the row number specified in column E. The +1 then adds a day.
- You need to manually enter the *first* task’s Start Date, because it has no predecessor. The formula can then be applied to all subsequent tasks.
- Create the Chart:
- Select the “Task Name” and “Start Date” columns.
- Go to “Insert” -> “Chart” -> “Bar” -> “Stacked Bar”.
- Add the “Duration” column to the chart as another data series. Right-click the chart, select “Select Data,” and add the Duration as a series.
- Format the Chart:
- Right-click the first data series (the Start Date series), and select “Format Data Series”. Set “Fill” to “No Fill” and “Border” to “No Line.” This makes the Start Date portion of the bar invisible, leaving only the Duration visible, representing the task length.
- Adjust the horizontal axis to start before your project start date. Right-click the horizontal axis, select “Format Axis,” and adjust the minimum value. Excel uses serial numbers for dates; you might need to experiment to find the right number. A good starting point is to subtract 5-10 days from your earliest start date and convert that to a serial number (format a cell as a date, enter the date, then change the format to “Number” to see the serial number).
- Reverse the vertical axis order so that the tasks appear in the order they are listed in your table. Right-click the vertical axis, select “Format Axis,” and check “Categories in reverse order.”
- Customize the chart’s appearance by adding titles, labels, and adjusting colors to your preference.
Maintaining and Updating the Gantt Chart
The beauty of this template is its dynamic nature. To update the chart:
- Adding Tasks: Simply add new rows to your data table and fill in the required information. The chart will automatically update.
- Changing Durations: Modify the “Duration (Days)” column, and the corresponding bar will adjust accordingly.
- Adjusting Dependencies: Change the “Predecessor” value to reflect updated task relationships. The dependent tasks will automatically shift their start dates. For example, if task 5 is now dependent on Task 2 instead of Task 3, change the value in Task 5’s Predecessor column from “3” to “2”.
Benefits of Using an Excel Gantt Chart Template with Dependencies
- Cost-Effective: Leverage existing Excel skills and avoid the cost of specialized project management software.
- Customizable: Adapt the template to fit your specific project needs and preferences.
- Easy to Use: The familiar Excel interface makes it easy for team members to understand and contribute.
- Visual Representation: Provides a clear visual overview of the project schedule, task dependencies, and progress.
- Dynamic Updates: Automatically adjusts task schedules based on changes in dependencies or durations.
Limitations
While powerful, this Excel template has limitations compared to dedicated project management software:
- Collaboration: Excel’s collaboration features are not as robust as dedicated project management tools.
- Complexity: Managing very large and complex projects with numerous dependencies can become cumbersome in Excel.
- Resource Management: Resource allocation and tracking are not natively supported.
- Advanced Features: Features like critical path analysis, resource leveling, and earned value management are not available.
In conclusion, an Excel Gantt chart template with dependencies provides a valuable and accessible tool for project planning and tracking, especially for smaller projects or teams with limited resources. By understanding the principles of Gantt charts and dependencies, and by carefully constructing your Excel template, you can effectively visualize your project timeline, manage task relationships, and improve your project management outcomes.
 1280×577 gantt chart excel understand task dependencies from www.ganttexcel.com
 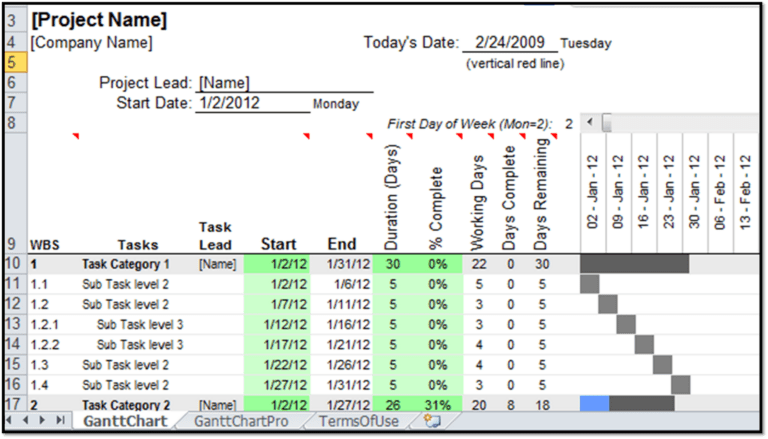 768×439 excel gantt chart template dependencies excelxocom from excelxo.com
 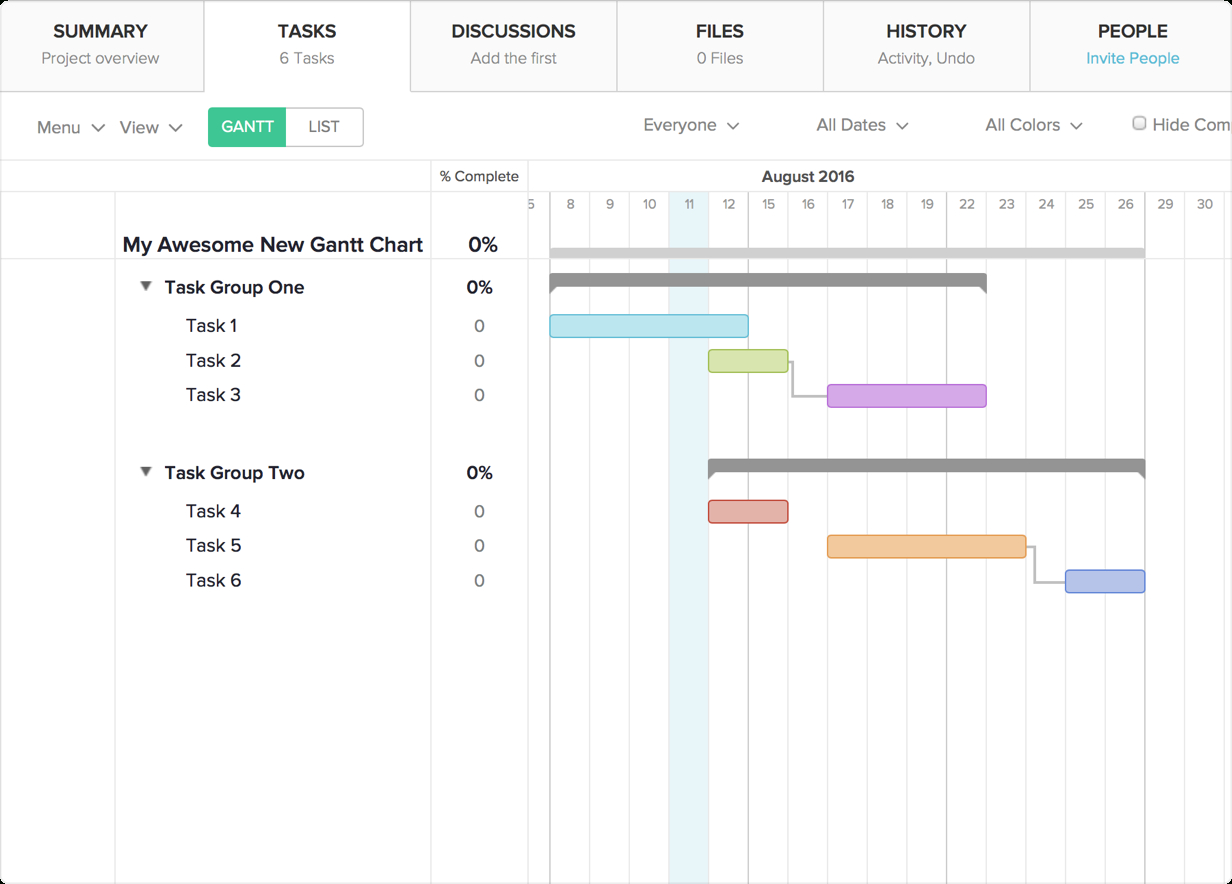 1232×884 excel gantt chart template dependencies db excelcom from db-excel.com
 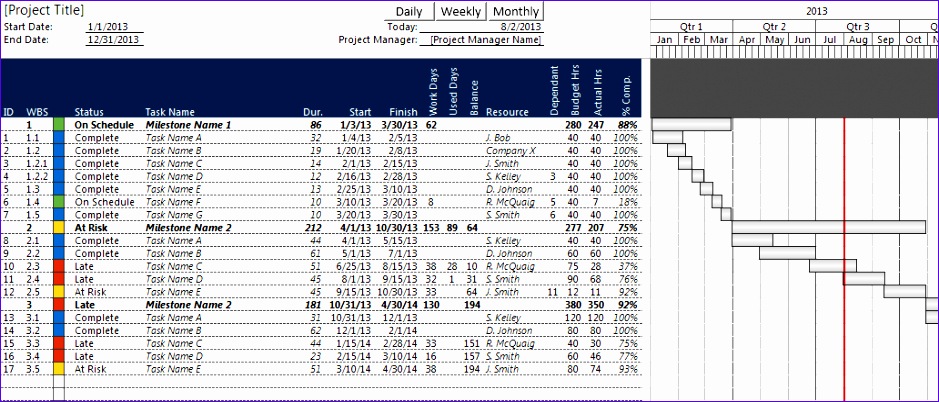 939×402 excel gantt chart template dependencies excel templates from www.exceltemplate123.us
  1112×875 gantt chart dependencies templates smartsheet from www.smartsheet.com
  2712×2712 excel gantt chart dependencies links project planner spreadsheet from www.eloquens.com
 Thank you for visiting Excel Gantt Chart Template With Dependencies. There are a lot of beautiful templates out there, but it can be easy to feel like a lot of the best cost a ridiculous amount of money, require special design. And if at this time you are looking for information and ideas regarding the Excel Gantt Chart Template With Dependencies then, you are in the perfect place. Get this Excel Gantt Chart Template With Dependencies for free here. We hope this post Excel Gantt Chart Template With Dependencies inspired you and help you what you are looking for.
Excel Gantt Chart Template With Dependencies was posted in December 16, 2025 at 1:36 am. If you wanna have it as yours, please click the Pictures and you will go to click right mouse then Save Image As and Click Save and download the Excel Gantt Chart Template With Dependencies Picture.. Don’t forget to share this picture with others via Facebook, Twitter, Pinterest or other social medias! we do hope you'll get inspired by SampleTemplates123... Thanks again! If you have any DMCA issues on this post, please contact us!