Google Sheets Gantt Chart Template
Google Sheets Gantt Chart Template: Project Management Made Easy
Google Sheets offers a surprisingly robust and accessible way to manage projects using a Gantt chart template. While dedicated project management software offers advanced features, Google Sheets provides a free and collaborative alternative, perfect for smaller teams and individuals who need a visual overview of their project timelines.
Understanding the Gantt Chart
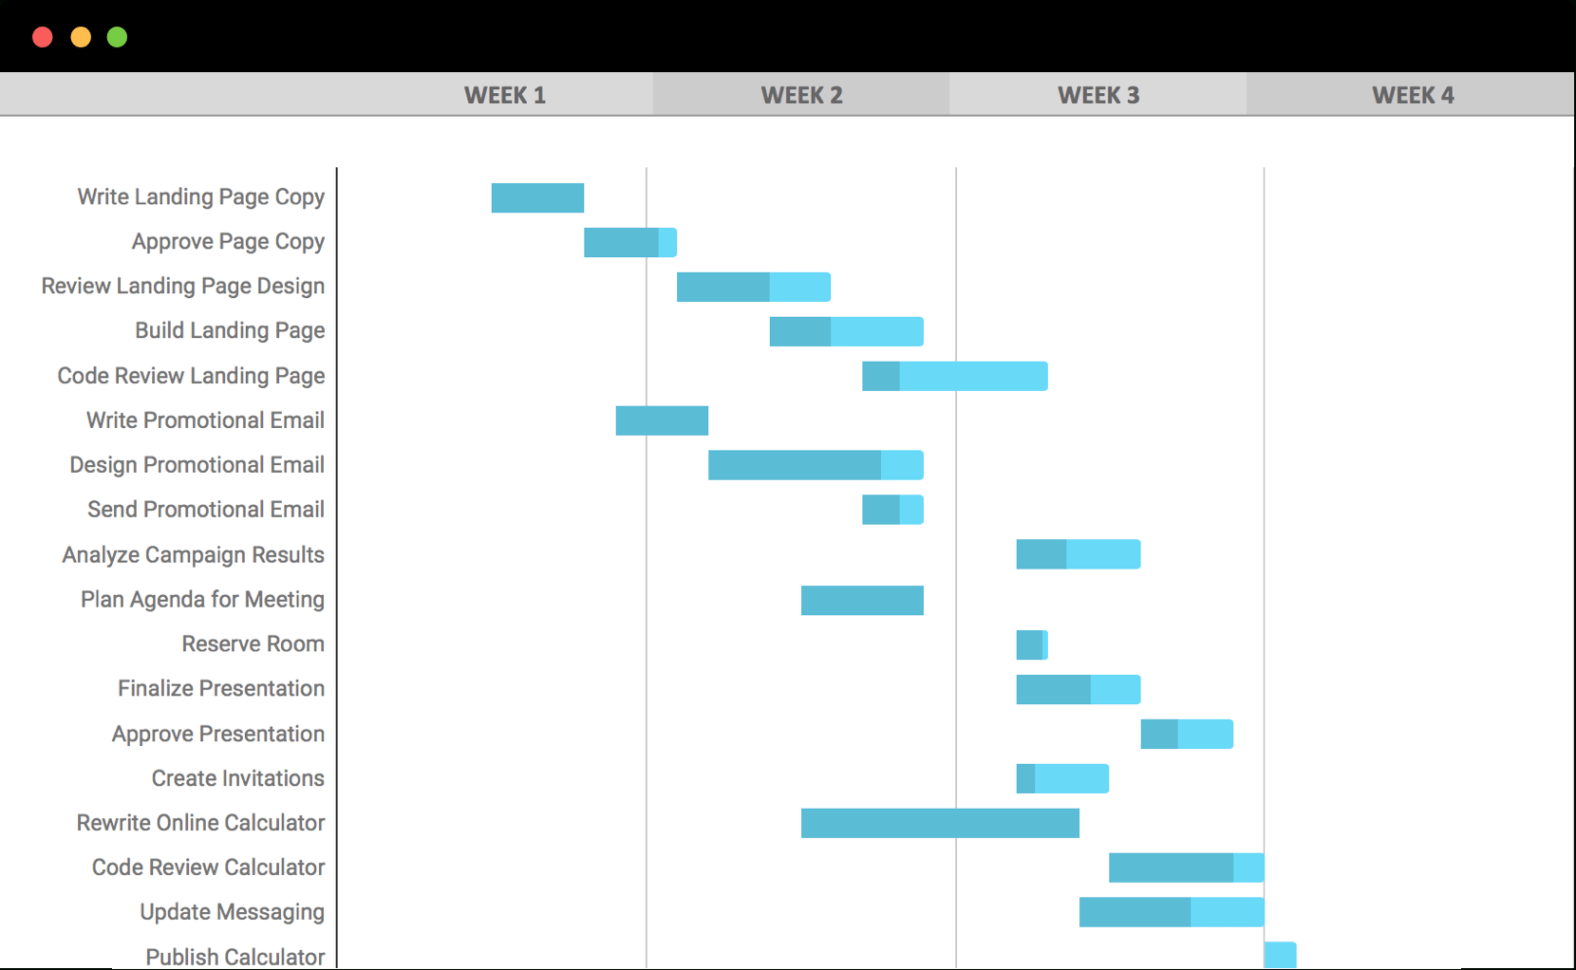
A Gantt chart is a visual representation of a project schedule. It displays tasks, their start and end dates, durations, and dependencies in a bar chart format. This visual layout allows project managers and team members to quickly understand the project timeline, track progress, and identify potential bottlenecks.
Finding the Google Sheets Gantt Chart Template
Google offers a readily available Gantt chart template within Sheets. To access it:
- Open Google Sheets (sheets.google.com).
- Click the “Template gallery” button in the top right corner.
- Scroll down to the “Project Management” section.
- Select the “Gantt Chart” template.
Alternatively, you can search directly for “Gantt Chart” within the template gallery.
Anatomy of the Gantt Chart Template
The template typically includes the following columns:
- Task Name: A brief description of the task.
- Start Date: The date the task is scheduled to begin.
- End Date: The date the task is scheduled to be completed.
- Duration (Days): The calculated length of the task based on the start and end dates. This column usually contains a formula that automatically calculates the duration.
- Dependencies: Indicates any tasks that must be completed before the current task can begin (using the Task Name). This is often used in conjunction with formulas or conditional formatting to visually link dependent tasks.
- % Complete: The percentage of the task that has been completed. This is used to track progress and update the visual representation of the task bar.
- Resources: Who is responsible for completing the task.
The visual representation of the Gantt chart is typically created using conditional formatting and formulas that automatically generate bars representing the task durations based on the start and end dates. The length of the bar directly corresponds to the duration of the task. As you update the “% Complete” column, the bars often visually change to reflect the progress, usually by changing the fill color.
Customizing the Gantt Chart Template
The default Google Sheets Gantt chart template is a good starting point, but you’ll likely need to customize it to fit your specific project needs.
- Adding/Removing Columns: You can add columns for other relevant information, such as priority, budget, risk assessment, or notes. Conversely, you can remove columns that aren’t necessary for your project.
- Adjusting Date Format: Ensure the date format matches your preferred style (e.g., MM/DD/YYYY or DD/MM/YYYY).
- Modifying Formulas: Carefully review the formulas used to calculate duration and generate the Gantt chart visualization. You might need to adjust them based on your specific requirements, especially if you’re dealing with weekends or holidays. The duration formula is typically something like `=NETWORKDAYS(B2,C2)` which calculates the number of working days between the start date (B2) and the end date (C2).
- Conditional Formatting: Customize the conditional formatting rules to change the appearance of the Gantt chart based on different criteria, such as task status, dependencies, or resource allocation. You can change the colors of the bars to indicate urgency, ownership, or completion status. For example, a task that is overdue could be formatted to display in red.
- Adding Milestones: Incorporate milestones to mark significant progress points in your project. These can be represented as diamond shapes or distinct markers on the Gantt chart.
- Dependencies Visualization: While the “Dependencies” column allows you to define task relationships, you can enhance the visualization by adding lines or arrows connecting dependent tasks on the Gantt chart. This requires more advanced techniques involving drawing tools or chart overlays.
- Resource Allocation: The “Resources” column allows you to assign individuals to tasks. You can create pivot tables or charts to analyze resource allocation and identify potential overloads.
Collaborating with Google Sheets
One of the biggest advantages of using Google Sheets for project management is its collaborative nature. You can easily share the spreadsheet with team members, allowing them to view, edit, and update the Gantt chart in real-time. This fosters transparency and ensures that everyone is on the same page.
Limitations of Google Sheets for Gantt Charts
While Google Sheets provides a convenient solution, it does have limitations compared to dedicated project management software:
- Complexity: Creating and maintaining complex Gantt charts with advanced dependencies and resource management can become cumbersome in Google Sheets.
- Automation: Dedicated project management tools offer more sophisticated automation features for task scheduling, progress tracking, and reporting.
- Reporting: While you can create basic charts and reports in Google Sheets, they may not be as comprehensive or customizable as those offered by specialized software.
- Scalability: Google Sheets may not be suitable for very large and complex projects with numerous tasks and dependencies.
Conclusion
The Google Sheets Gantt chart template is a valuable tool for basic project management. It’s free, accessible, collaborative, and easy to use, making it ideal for individuals and small teams. While it has limitations compared to dedicated project management software, it’s a great option for visualizing project timelines and tracking progress on simpler projects. By customizing the template and leveraging Google Sheets’ collaborative features, you can effectively manage your projects and keep your team informed.
 1576×970 google sheets gantt chart template teamgantt gantt from db-excel.com
  1170×658 gantt chart excel template google sheets compatible from spitmarket.com
  1202×601 gantt chart google sheets template deeps from www.deepsonline.com
 :max_bytes(150000):strip_icc()/gantt-chart-5c8ac373c9e77c0001e11d0f.png) 1209×806 create gantt chart google sheets from www.lifewire.com
1209×806 create gantt chart google sheets from www.lifewire.com 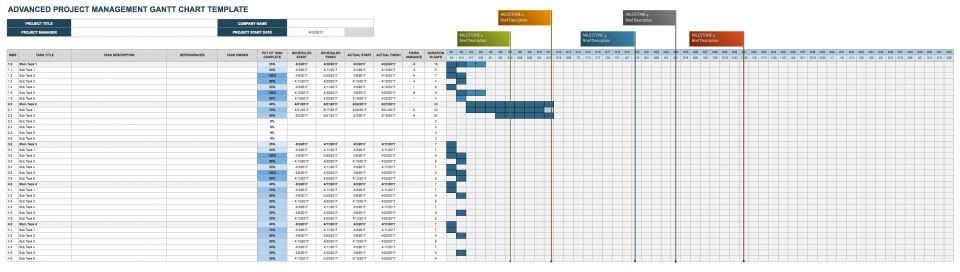 960×272 google sheets gantt chart templates smartsheet from www.smartsheet.com
  1786×1040 google sheet gantt chart template from instagantt.com
  1300×781 gantt chart google sheets smartsheet from www.smartsheet.com
 Thank you for visiting Google Sheets Gantt Chart Template. There are a lot of beautiful templates out there, but it can be easy to feel like a lot of the best cost a ridiculous amount of money, require special design. And if at this time you are looking for information and ideas regarding the Google Sheets Gantt Chart Template then, you are in the perfect place. Get this Google Sheets Gantt Chart Template for free here. We hope this post Google Sheets Gantt Chart Template inspired you and help you what you are looking for.
Google Sheets Gantt Chart Template was posted in December 3, 2025 at 5:13 am. If you wanna have it as yours, please click the Pictures and you will go to click right mouse then Save Image As and Click Save and download the Google Sheets Gantt Chart Template Picture.. Don’t forget to share this picture with others via Facebook, Twitter, Pinterest or other social medias! we do hope you'll get inspired by SampleTemplates123... Thanks again! If you have any DMCA issues on this post, please contact us!