Google Sheets Gantt Chart Template For Project Management
Google Sheets Gantt Chart Template: A Project Manager’s Best Friend
For project managers seeking a simple, accessible, and cost-effective way to visualize timelines and manage tasks, the Google Sheets Gantt chart template offers a powerful solution. This readily available tool allows for effective project planning, tracking progress, and ensuring timely completion without the need for specialized or expensive software.
What is a Gantt Chart?
A Gantt chart is a visual representation of a project schedule. It uses horizontal bars to depict tasks, their start and end dates, and their duration. Dependencies between tasks can also be illustrated, showing how one task’s completion impacts the start date of another. This visual clarity helps project managers identify potential bottlenecks, allocate resources effectively, and monitor overall project progress.
Why Use Google Sheets for Gantt Charts?
Google Sheets offers several advantages for creating and using Gantt charts:
- Accessibility: Google Sheets is a cloud-based platform, meaning it can be accessed from any device with an internet connection. This fosters collaboration and allows team members to view and update the chart in real-time.
- Cost-Effectiveness: Google Sheets is free to use with a Google account, making it an ideal solution for individuals, small teams, or organizations with budget constraints.
- Ease of Use: While more sophisticated project management software can be complex, Google Sheets is relatively easy to learn and use. The template provides a pre-formatted structure, minimizing the learning curve.
- Collaboration: Google Sheets excels in collaborative environments. Multiple users can simultaneously edit and comment on the chart, promoting seamless communication and shared understanding of project status.
- Customization: The template is highly customizable. Users can modify the chart to fit the specific needs of their project, adding or removing columns, adjusting colors, and implementing formulas for calculations.
- Integration: Google Sheets integrates seamlessly with other Google Workspace applications, such as Google Calendar and Google Docs, streamlining project management workflows.
Utilizing the Google Sheets Gantt Chart Template
The Google Sheets Gantt chart template typically includes the following columns:
- Task Name: A descriptive name for each individual task within the project.
- Start Date: The date on which the task is scheduled to begin.
- End Date: The date on which the task is scheduled to be completed.
- Duration: The number of days or weeks required to complete the task (often automatically calculated based on the start and end dates).
- Dependencies: Indicates any tasks that must be completed before the current task can begin. This column helps to visualize the critical path of the project.
- Assignee: The person responsible for completing the task.
- Status: Indicates the current progress of the task (e.g., “Not Started,” “In Progress,” “Completed,” “Delayed”).
- Percentage Complete: A numerical representation of the task’s progress, allowing for more granular tracking.
How to use the template:
- Find a Template: Search for “Gantt chart template” within Google Sheets (File > New > From template gallery). Choose a template that suits your project’s complexity.
- Populate the Task List: Enter all the tasks required for your project in the “Task Name” column.
- Define Start and End Dates: Input the planned start and end dates for each task. The duration column should automatically update.
- Establish Dependencies: Use the “Dependencies” column to indicate any prerequisite tasks. Some templates may automatically adjust start dates based on dependencies.
- Assign Responsibilities: Assign each task to a specific team member using the “Assignee” column.
- Update Status: Regularly update the “Status” and “Percentage Complete” columns to reflect the current progress of each task. This allows for real-time monitoring of project health.
- Customize as Needed: Adjust colors, add columns for notes or priority, and modify formulas to fit your specific project requirements.
Tips for Effective Gantt Chart Management in Google Sheets
- Regular Updates: The Gantt chart is only effective if it’s kept up-to-date. Encourage team members to regularly update task statuses and report any delays or roadblocks.
- Use Conditional Formatting: Apply conditional formatting to highlight overdue tasks or tasks that are nearing their deadlines. This provides visual cues for potential issues.
- Automate Calculations: Utilize formulas to automatically calculate task duration, project completion percentage, and other key metrics. This reduces manual effort and improves accuracy.
- Communicate Clearly: Use the Gantt chart as a communication tool to keep all stakeholders informed of project progress. Share the chart regularly and discuss any challenges or adjustments.
- Consider Add-ons: For more advanced functionality, explore Google Sheets add-ons specifically designed for project management. These add-ons can provide features such as automated task scheduling, resource allocation, and reporting.
Limitations
While the Google Sheets Gantt chart template is a valuable tool, it has limitations compared to dedicated project management software. It may lack features such as resource leveling, critical path analysis, and advanced reporting. For complex projects with numerous dependencies and resources, specialized software might be a better choice.
Conclusion
The Google Sheets Gantt chart template is a powerful and accessible tool for project managers of all levels. Its ease of use, collaborative capabilities, and cost-effectiveness make it an excellent option for visualizing timelines, tracking progress, and ensuring project success. By following the tips outlined above and regularly updating the chart, project managers can effectively manage their projects and deliver results on time and within budget.
 0 x 0 google sheets gantt chart template teamgantt from www.teamgantt.com
 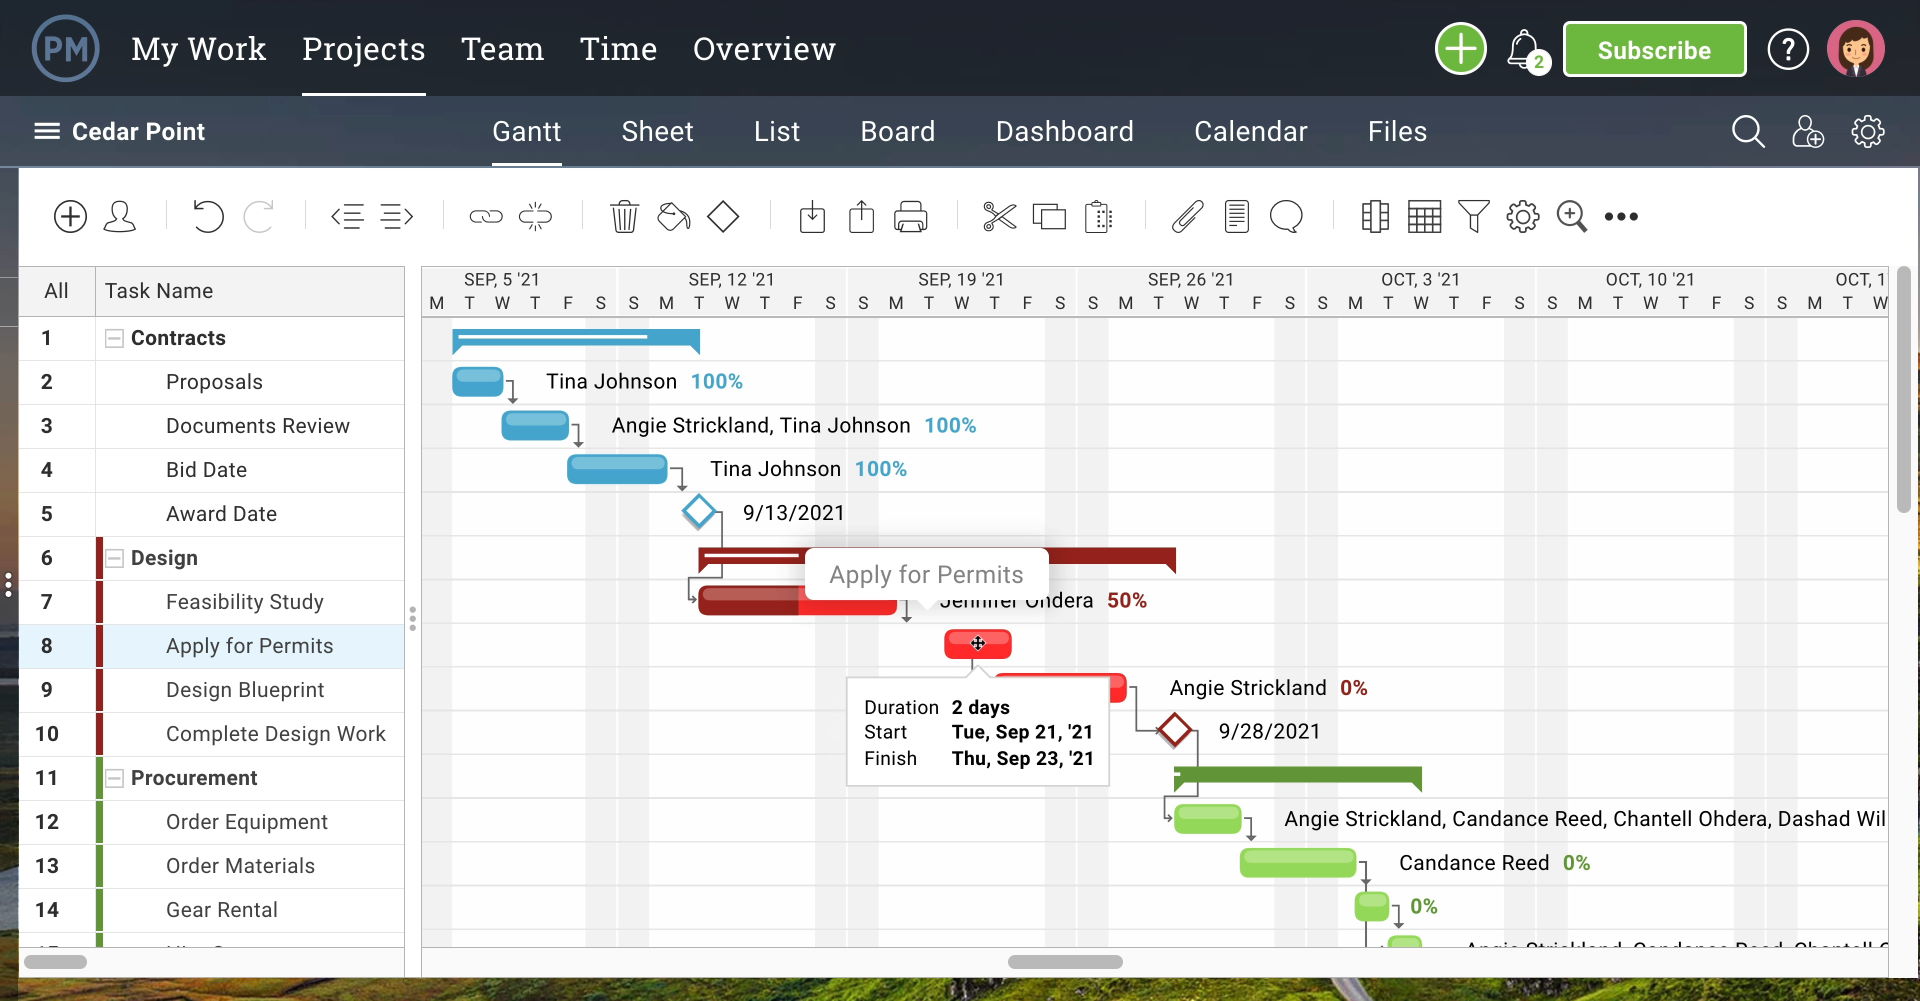 1920×1001 easy ways create gantt chart google sheets templates from www.projectmanager.com
  1387×829 gantt chart google sheets edrawmax from www.edrawmax.com
 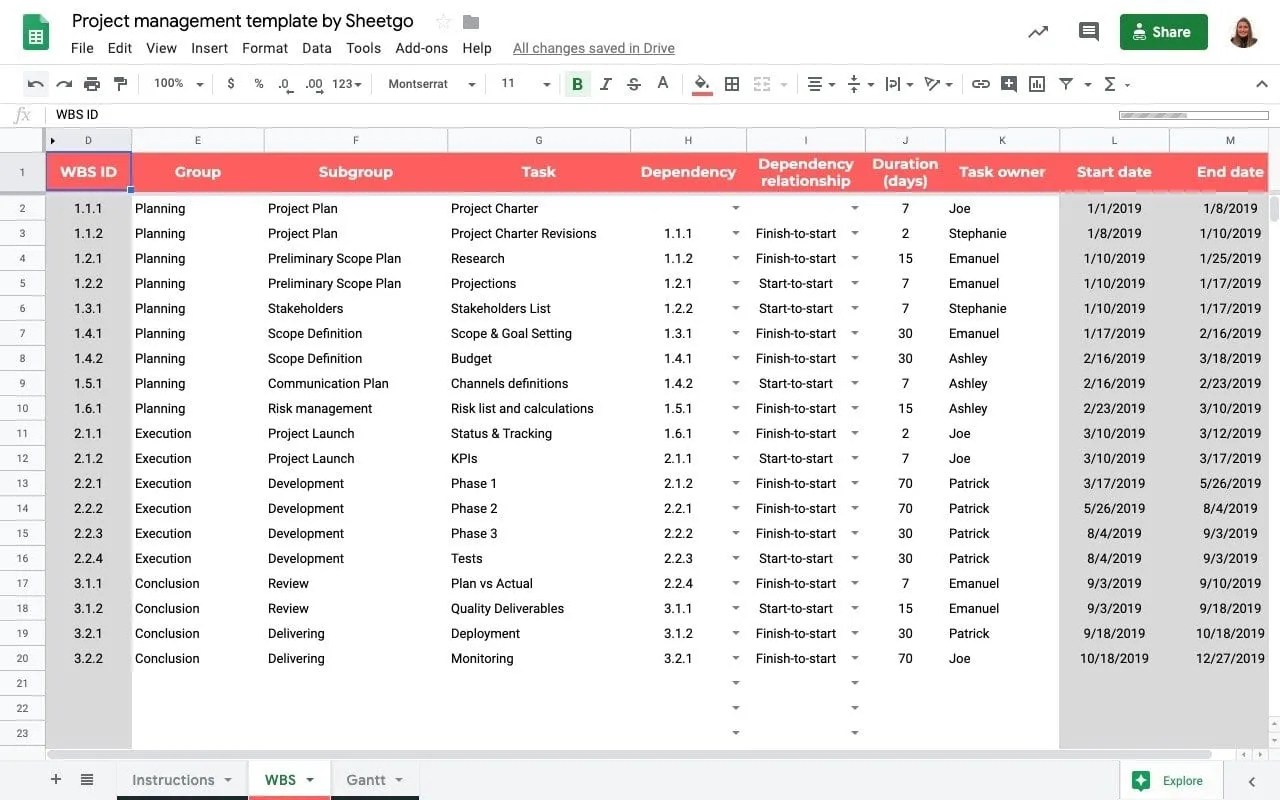 1280×800 project management template google sheets sheetgo blog from blog.sheetgo.com
 Thank you for visiting Google Sheets Gantt Chart Template For Project Management. There are a lot of beautiful templates out there, but it can be easy to feel like a lot of the best cost a ridiculous amount of money, require special design. And if at this time you are looking for information and ideas regarding the Google Sheets Gantt Chart Template For Project Management then, you are in the perfect place. Get this Google Sheets Gantt Chart Template For Project Management for free here. We hope this post Google Sheets Gantt Chart Template For Project Management inspired you and help you what you are looking for.
Google Sheets Gantt Chart Template For Project Management was posted in October 25, 2025 at 6:59 pm. If you wanna have it as yours, please click the Pictures and you will go to click right mouse then Save Image As and Click Save and download the Google Sheets Gantt Chart Template For Project Management Picture.. Don’t forget to share this picture with others via Facebook, Twitter, Pinterest or other social medias! we do hope you'll get inspired by SampleTemplates123... Thanks again! If you have any DMCA issues on this post, please contact us!