Google Sheets Gantt Chart Template With Milestones
Google Sheets Gantt Chart Template with Milestones
Managing projects effectively requires clear visualization and a robust tracking system. A Gantt chart, a visual representation of a project schedule, is an invaluable tool for project managers. Google Sheets offers a surprisingly powerful platform for creating and customizing Gantt charts, especially when incorporating milestones.
Why Use Google Sheets for Gantt Charts?
While dedicated project management software offers advanced features, Google Sheets provides a user-friendly, accessible, and collaborative environment for creating basic to intermediate Gantt charts. Its benefits include:
- Accessibility: Google Sheets is a web-based application, accessible from any device with an internet connection.
- Collaboration: Multiple users can simultaneously view and edit the chart, promoting teamwork and transparency.
- Cost-effective: Google Sheets is free to use with a Google account.
- Customization: Although simpler than dedicated software, Google Sheets allows for significant customization to meet specific project needs.
- Ease of Use: The familiar spreadsheet interface makes it easier to learn and use compared to more complex project management tools.
Building a Gantt Chart Template with Milestones in Google Sheets
Creating a Gantt chart template in Google Sheets involves a few key steps:
1. Setting Up the Data Table
Start by creating a table with the following columns:
- Task: The name of each project task.
- Start Date: The date when the task is scheduled to begin.
- End Date: The date when the task is scheduled to be completed.
- Duration: The number of days the task is expected to take (calculated automatically).
- Milestone: A checkbox or a “Yes/No” column to indicate if the task is a milestone.
- Dependencies: (Optional) List any preceding tasks that must be completed before the current task can begin.
Populate the table with your project’s tasks, start dates, and end dates. The “Duration” column can be calculated using the formula: `=END_DATE – START_DATE + 1`. Remember to format the Start and End Date columns as dates.
2. Creating the Chart
To create the Gantt chart, you’ll use a stacked bar chart. Here’s how:
- Select the “Task” and “Duration” columns.
- Go to “Insert” > “Chart”.
- In the Chart editor, under “Chart type,” choose “Stacked bar chart.”
- Under “Data range,” ensure the range includes your “Task” and “Duration” columns.
- Under “Series,” remove any automatically added series other than ‘Duration’ at this point (We’ll add another in a moment).
- Under ‘X-axis’ choose ‘Task’.
The chart will initially show a stacked bar chart with the tasks on the Y-axis and the duration on the X-axis. We will customize to create the appearance of a Gantt chart.
3. Customizing the Chart
Now comes the customization to transform the stacked bar chart into a Gantt chart:
- Click the three dots (…) on the chart and select “Edit chart”.
- In the “Chart editor,” go to the “Customize” tab.
- Under “Series,” select “Duration.” If the ‘Duration’ series isn’t visible under ‘Series’ try ‘Add Series’ and select the duration column again.
- Under ‘Series’, set ‘Color’ to a desired color for representing task durations.
- Under ‘Chart Style’, select ‘Maximize’.
- Add a series using the Start Date column. Under “Series,” click “Add Series” and select the “Start Date” column. Set ‘Color’ to “None” (or transparent). This effectively shifts the duration bars to the correct start dates. This makes the start date part ‘invisible’, leaving the ‘duration’ section visible and starting from the correct date.
- Under ‘Horizontal axis’ configure ‘Format’ to the date format you prefer.
4. Adding Milestones
Milestones represent significant checkpoints in the project. To incorporate them into your Gantt chart:
- Conditional Formatting: Select the “Task” column. Go to “Format” > “Conditional formatting.” Create a new rule: “Format cells if…” > “Custom formula is…” Enter a formula like `=IF($E1=”Yes”,TRUE,FALSE)` (assuming your “Milestone” column is column E). Then, choose a distinct formatting style for the milestone tasks (e.g., bold text, different background color).
- Symbolic Representation on the Chart: This requires a workaround as Google Sheets charts lack a direct milestone marker feature. You can add a separate column (e.g., “Milestone Marker”) with a fixed value (e.g., 1) only for milestone tasks. Then, add this column as a series to the chart and change its chart type to a scatter plot. Customize the scatter plot markers to visually represent the milestones (e.g., diamonds, stars). Manually adjust the scatter plot’s vertical position to align with the corresponding tasks. This approach is more complex and less automated but provides a visual representation of milestones on the chart itself.
5. Adding Dependencies (Advanced)
While Google Sheets doesn’t natively handle dependencies in Gantt charts, you can visually represent them using drawing tools. Draw arrows connecting dependent tasks. This approach is manual and requires updating the arrows whenever the schedule changes. Alternatively, explore add-ons that offer more sophisticated dependency management.
Maintaining and Updating the Gantt Chart
The real value of a Gantt chart lies in its ability to be updated and adapted as the project progresses. Regularly review and adjust the start and end dates of tasks, and update the chart accordingly. Conditional formatting will automatically highlight milestones, and the chart will dynamically adjust based on the updated data.
Conclusion
A Gantt chart template in Google Sheets, enhanced with milestones, provides a powerful yet accessible way to visualize and manage projects. While it may lack the advanced features of dedicated project management software, its accessibility, collaborative nature, and cost-effectiveness make it a valuable tool for individuals and small teams looking to improve their project planning and tracking.
 0 x 0 google sheets gantt chart template teamgantt from www.teamgantt.com
  850×463 gantt chart excel template google sheets compatible from spitmarket.com
  1202×601 gantt chart google sheets template deeps from www.deepsonline.com
  1920×631 create gantt charts google sheets couplerio blog from blog.coupler.io
  1786×1040 google sheet gantt chart template from instagantt.com
 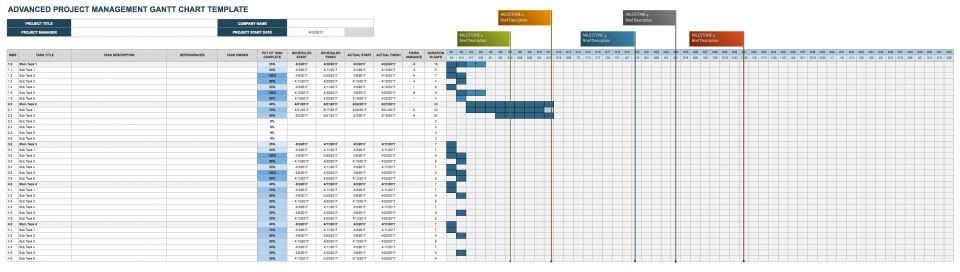 960×272 google sheets gantt chart templates smartsheet from www.smartsheet.com
  1300×781 gantt chart google sheets smartsheet from www.smartsheet.com
 Thank you for visiting Google Sheets Gantt Chart Template With Milestones. There are a lot of beautiful templates out there, but it can be easy to feel like a lot of the best cost a ridiculous amount of money, require special design. And if at this time you are looking for information and ideas regarding the Google Sheets Gantt Chart Template With Milestones then, you are in the perfect place. Get this Google Sheets Gantt Chart Template With Milestones for free here. We hope this post Google Sheets Gantt Chart Template With Milestones inspired you and help you what you are looking for.
Google Sheets Gantt Chart Template With Milestones was posted in November 13, 2025 at 6:20 pm. If you wanna have it as yours, please click the Pictures and you will go to click right mouse then Save Image As and Click Save and download the Google Sheets Gantt Chart Template With Milestones Picture.. Don’t forget to share this picture with others via Facebook, Twitter, Pinterest or other social medias! we do hope you'll get inspired by SampleTemplates123... Thanks again! If you have any DMCA issues on this post, please contact us!