PowerPoint Gantt Chart Template With Dependencies
PowerPoint Gantt Chart Template with Dependencies
A Gantt chart is a powerful visual tool used for project scheduling and management. It provides a clear timeline of tasks, their durations, and their relationships. Using a Gantt chart template in PowerPoint offers a readily accessible and easily customizable way to visualize your project plan, even if you’re not a dedicated project management software user. Adding dependencies to your PowerPoint Gantt chart elevates its effectiveness, allowing you to represent the real-world constraints and interdependencies that often dictate project progress.
Why Use PowerPoint for Gantt Charts?
While dedicated project management software like Microsoft Project or Asana offers robust features, PowerPoint provides several advantages for creating and presenting Gantt charts:
- Familiarity: Most users are already comfortable with PowerPoint’s interface, reducing the learning curve.
- Accessibility: PowerPoint is often readily available in office suites, eliminating the need for additional software purchases.
- Ease of Customization: PowerPoint offers flexibility in terms of design and aesthetics, allowing you to tailor the chart to match your company branding or presentation style.
- Presentation-Ready: PowerPoint is designed for presentations, making it seamless to integrate your Gantt chart into a larger project update or proposal.
- Collaboration: PowerPoint files can be easily shared and collaborated on by multiple team members.
Understanding Dependencies in Gantt Charts
Dependencies, also known as task relationships or precedence relationships, define the order in which tasks must be completed. They illustrate how the start or finish of one task affects the start or finish of another. Representing dependencies on a Gantt chart is crucial for realistic project planning, as it accurately reflects the constraints of the project and helps to identify potential bottlenecks.
The four main types of dependencies are:
- Finish-to-Start (FS): The most common type, where a task cannot start until the preceding task finishes. (Task B cannot start until Task A is finished).
- Start-to-Start (SS): A task cannot start until the preceding task starts. (Task B cannot start until Task A has started).
- Finish-to-Finish (FF): A task cannot finish until the preceding task finishes. (Task B cannot finish until Task A has finished).
- Start-to-Finish (SF): A task cannot finish until the preceding task starts. (Task B cannot finish until Task A has started – less common).
Creating a PowerPoint Gantt Chart Template with Dependencies
While PowerPoint doesn’t have built-in Gantt chart functionality with automated dependency links, you can create a functional and visually appealing Gantt chart using shapes, tables, and connectors.
- Start with a Template or Table: Begin with a pre-designed Gantt chart template (many are available online for free or purchase) or create a basic table. The table should have columns for Task Name, Start Date, End Date, Duration, and Dependency.
- Populate Task Information: Enter each task, its start date, end date, and duration into the table. Accurately calculate the duration (in days, weeks, or months) for each task.
- Represent Task Bars: Use rectangular shapes (from the “Insert” > “Shapes” menu) to represent each task’s duration on a timeline. Position the shapes according to their start and end dates on the chart. The length of the rectangle visually represents the task’s duration.
- Add a Timeline: Create a horizontal axis to represent the project timeline. Mark significant milestones or dates on the timeline.
- Illustrate Dependencies: Use connector lines (also from “Insert” > “Shapes”) to visually represent dependencies between tasks. Connectors should start at the end of the preceding task and point to the start of the dependent task. Use different arrow styles or colors to differentiate between dependency types (FS, SS, FF, SF). For example, a solid line with an arrowhead could represent a Finish-to-Start dependency.
- Customize Appearance: Use PowerPoint’s formatting tools to customize the colors, fonts, and styles of the chart elements. Use color-coding to highlight critical tasks or task groups.
- Add Milestones: Use diamond shapes or other distinct markers to represent key project milestones on the timeline.
- Update Regularly: A Gantt chart is a living document. Update it regularly to reflect actual progress, changes in dates, or new tasks.
Tips for Effective PowerPoint Gantt Charts with Dependencies
- Keep it Simple: Avoid overcrowding the chart with too much detail. Focus on essential tasks and dependencies.
- Use Clear Labels: Label all tasks, milestones, and dependencies clearly.
- Choose Readable Colors: Use a color palette that is visually appealing and easy to read. Avoid using too many bright colors that can be distracting.
- Zoom Appropriately: Adjust the zoom level to ensure that the chart is easily readable, especially when presenting to a large audience.
- Group Related Tasks: Organize tasks into logical groups or phases to improve clarity.
- Use Conditional Formatting (with limitations): While PowerPoint doesn’t have true conditional formatting for Gantt charts like Excel, you can manually change the color of a task bar as it progresses to visually indicate its completion status.
- Consider Linking to Data (Advanced): For more dynamic Gantt charts, explore linking your PowerPoint chart to an Excel spreadsheet. This allows you to update task information in Excel and have the Gantt chart in PowerPoint automatically reflect the changes. This requires some knowledge of Excel and PowerPoint’s data linking capabilities.
Limitations of PowerPoint Gantt Charts with Dependencies
While PowerPoint is a versatile tool, it has limitations compared to dedicated project management software:
- Lack of Automation: Dependencies are manually drawn and maintained. There’s no automatic rescheduling of dependent tasks if a preceding task is delayed.
- Limited Collaboration Features: Collaboration features are less sophisticated than those found in dedicated project management software.
- No Critical Path Analysis: PowerPoint does not offer built-in critical path analysis to identify the most important tasks that impact the project’s overall completion date.
- Scalability: PowerPoint Gantt charts can become unwieldy for large and complex projects with numerous tasks and dependencies.
Conclusion
A PowerPoint Gantt chart template with dependencies is a valuable tool for visualizing project timelines and relationships, especially for smaller projects or presentations. While it lacks the advanced features of dedicated project management software, its familiarity, accessibility, and ease of customization make it a practical option for many users. By understanding how to create and use dependencies effectively, you can create a more realistic and informative Gantt chart in PowerPoint that enhances your project planning and communication.
 960×720 dependencies gantt chart powerpoint gantt chart templates slideuplift from slideuplift.com
  1826×724 gantt chart dependencies templates smartsheet from www.smartsheet.com
  1280×720 gantt charts powerpoint templates powerslides from www.powerslides.com
 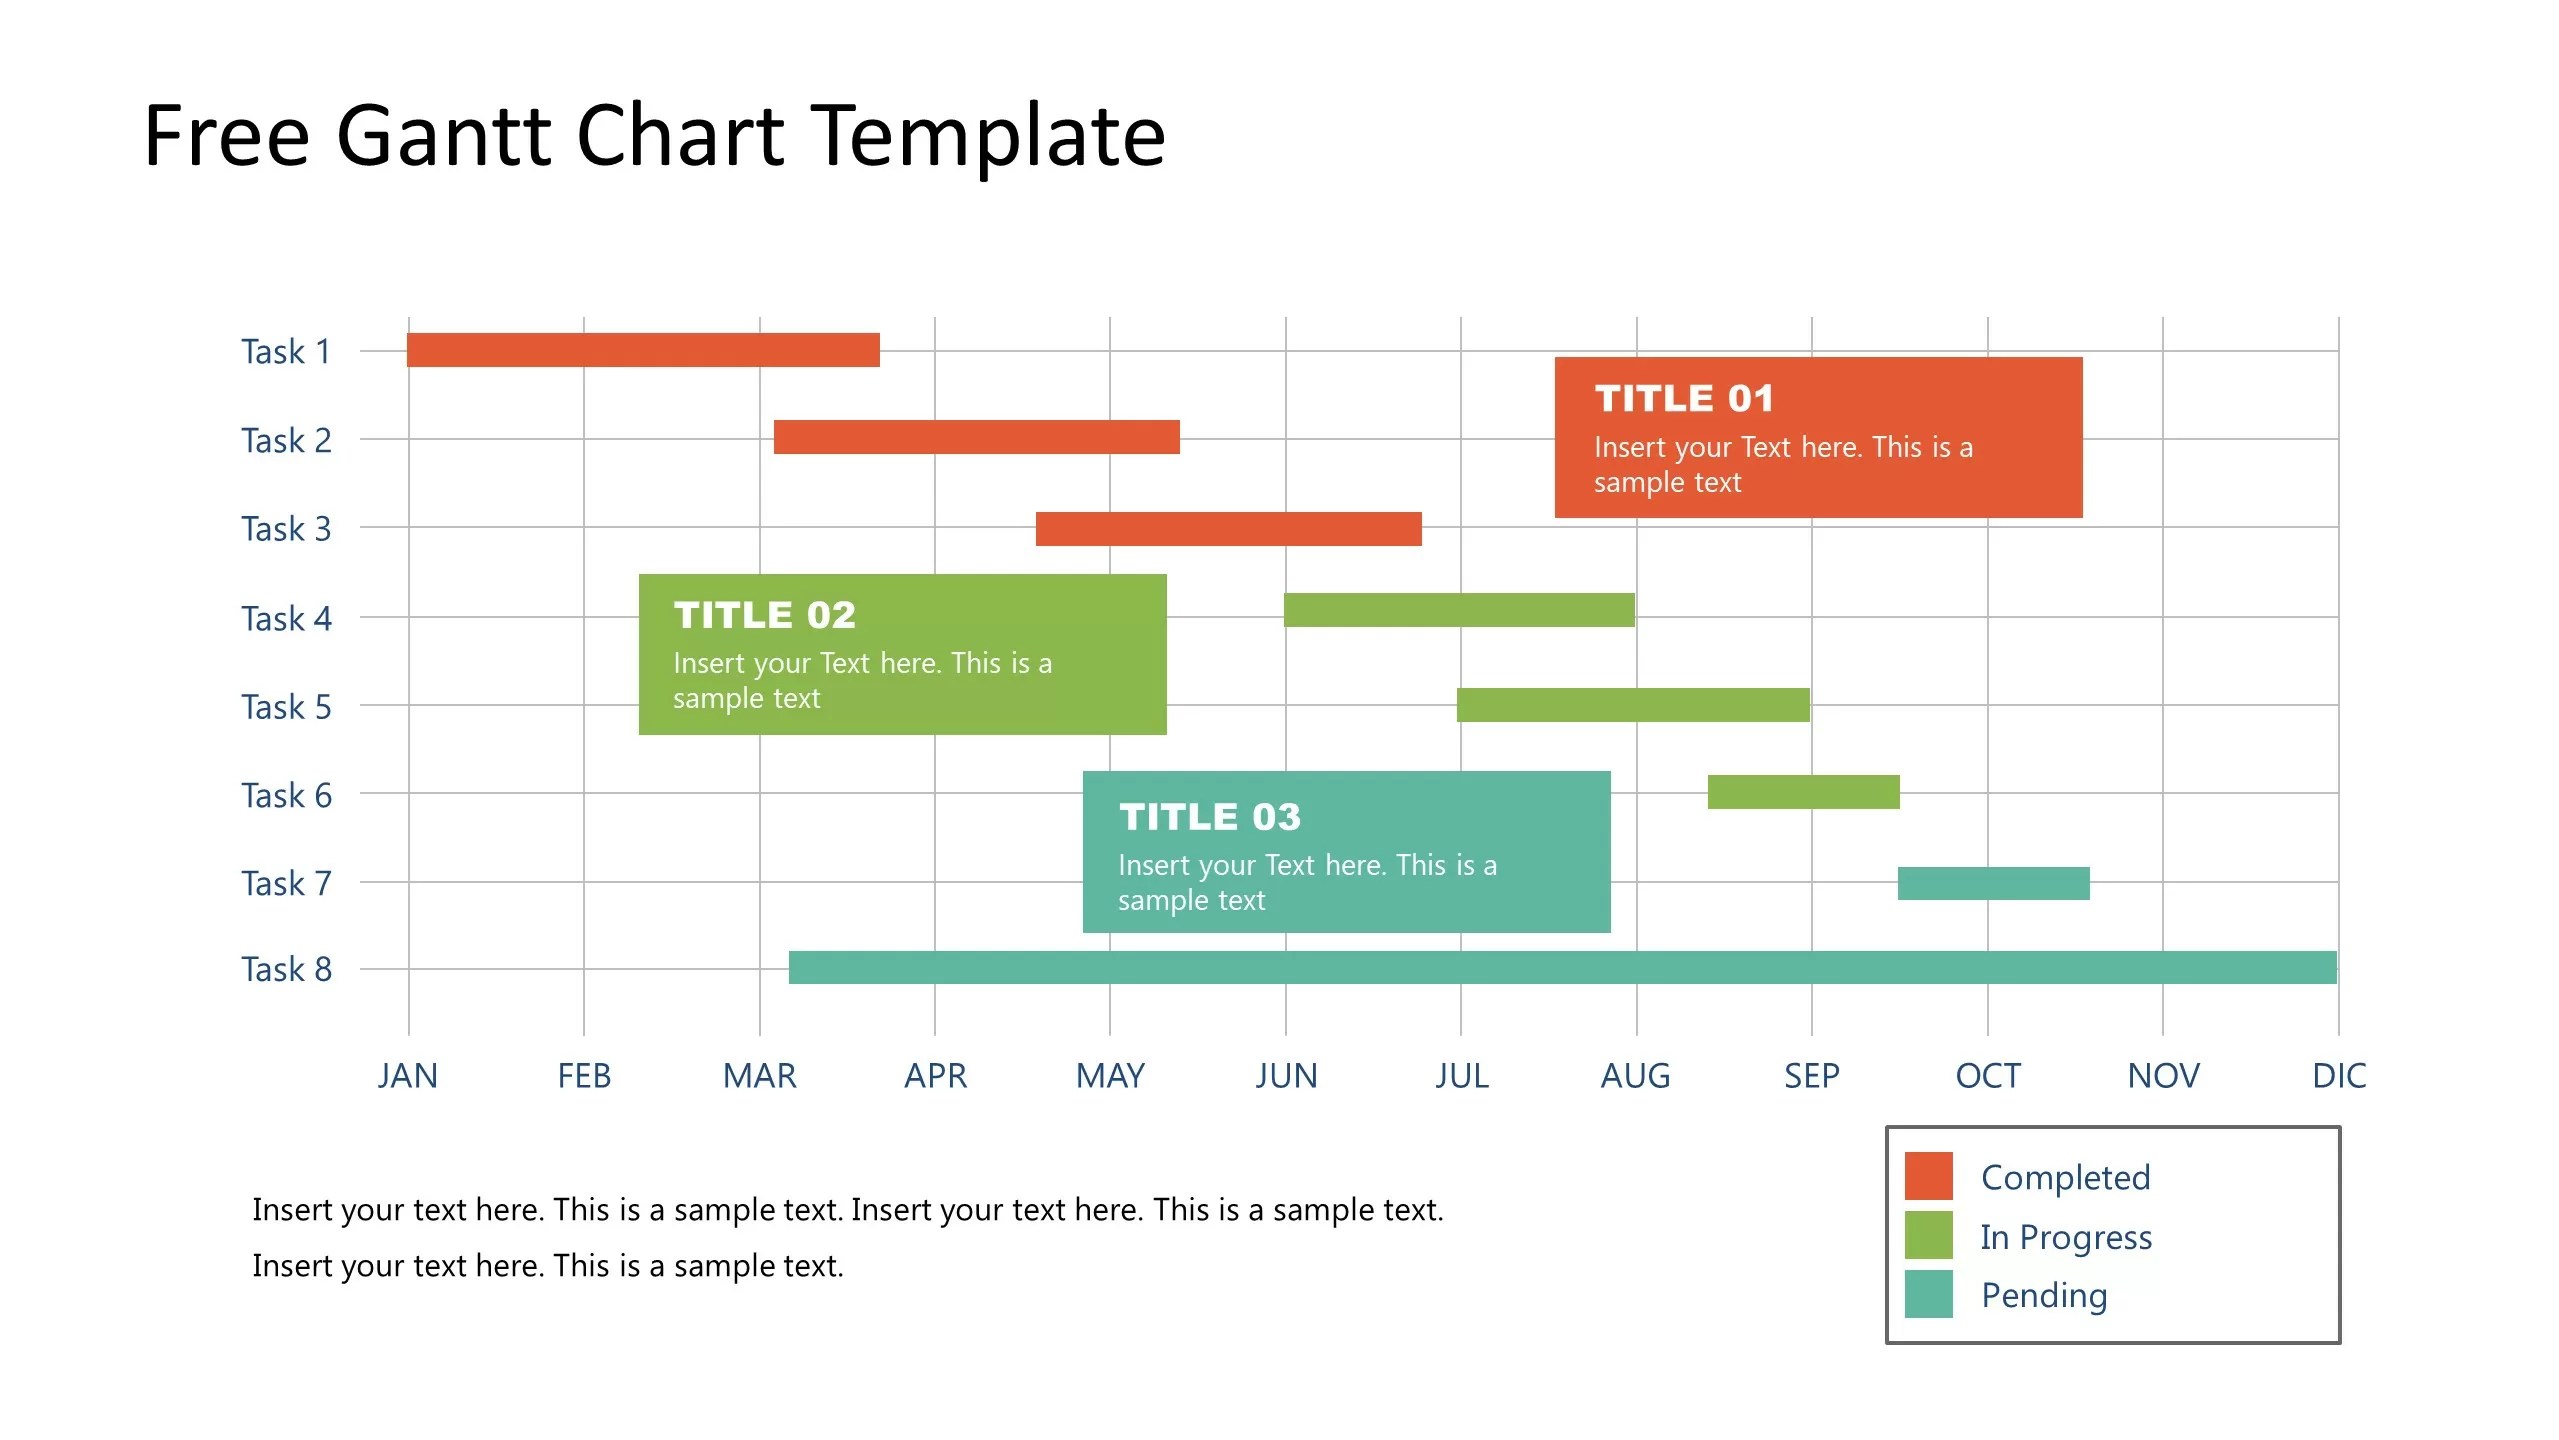 2559×1440 gantt chart powerpoint templates slidemodel from slidemodel.com
 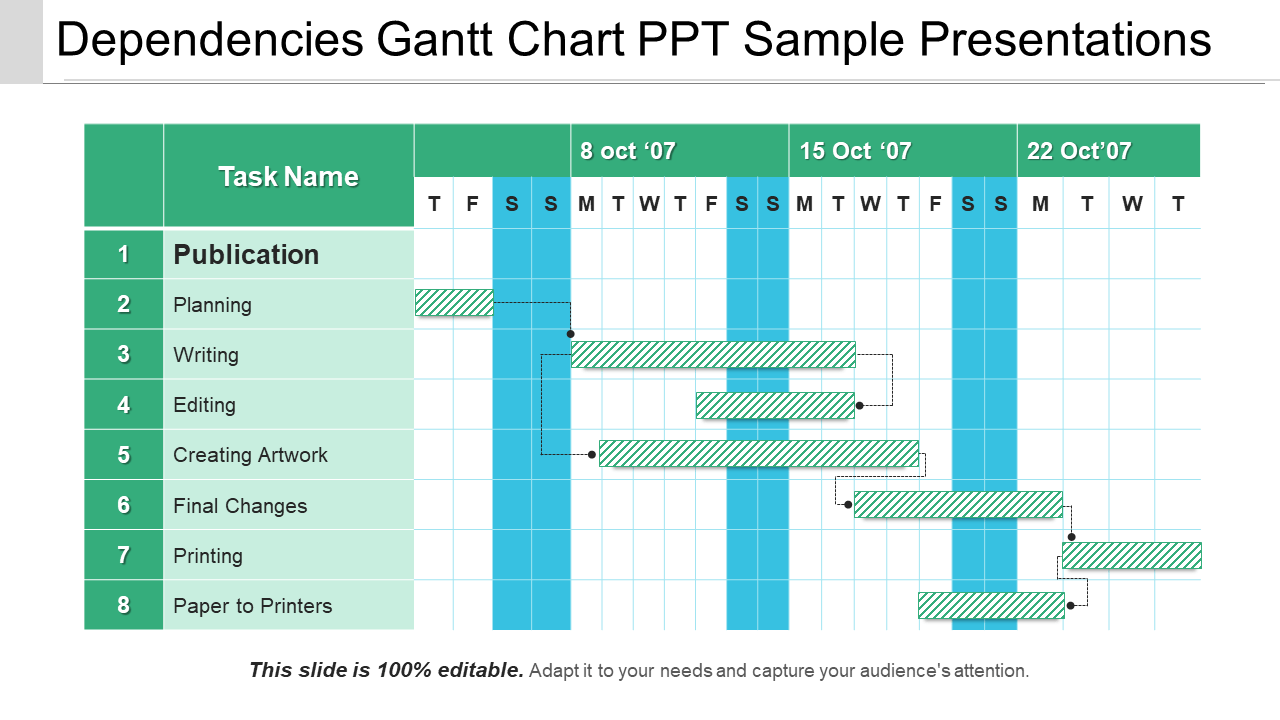 1280×720 gantt chart template from lesboucans.com
 Thank you for visiting PowerPoint Gantt Chart Template With Dependencies. There are a lot of beautiful templates out there, but it can be easy to feel like a lot of the best cost a ridiculous amount of money, require special design. And if at this time you are looking for information and ideas regarding the PowerPoint Gantt Chart Template With Dependencies then, you are in the perfect place. Get this PowerPoint Gantt Chart Template With Dependencies for free here. We hope this post PowerPoint Gantt Chart Template With Dependencies inspired you and help you what you are looking for.
PowerPoint Gantt Chart Template With Dependencies was posted in September 9, 2025 at 1:56 pm. If you wanna have it as yours, please click the Pictures and you will go to click right mouse then Save Image As and Click Save and download the PowerPoint Gantt Chart Template With Dependencies Picture.. Don’t forget to share this picture with others via Facebook, Twitter, Pinterest or other social medias! we do hope you'll get inspired by SampleTemplates123... Thanks again! If you have any DMCA issues on this post, please contact us!