Advanced Excel Template Ideas
Advanced Excel Template Ideas: Level Up Your Spreadsheet Game
Excel templates are fantastic for streamlining repetitive tasks and ensuring consistency in data management. But beyond the basics of budgeting and inventory tracking, lies a world of advanced templates that can significantly boost productivity and provide deeper insights. Here are some ideas to inspire you, focusing on features like dynamic dashboards, interactive visualizations, and sophisticated data analysis.
Dynamic Dashboards with Interactive Controls
Go beyond static reports and create dashboards that react to user input. Key elements include:
* **Slicers and Timelines:** Connect slicers to pivot tables to filter data based on specific criteria (e.g., region, product category, time period). Timelines provide a user-friendly way to filter dates dynamically. * **Form Controls (Checkboxes, Option Buttons, Drop-Down Lists):** Use form controls linked to formulas to allow users to select different scenarios or metrics to analyze. For instance, a “Best Case,” “Worst Case,” and “Most Likely” scenario selection in a financial model. * **Conditional Formatting based on User Input:** Highlight key performance indicators (KPIs) based on thresholds set by the user. For example, the user could adjust a target sales figure, and the dashboard would automatically highlight sales representatives who are above or below that target. * **Data Validation with Custom Error Messages:** Prevent incorrect data entry by restricting the types of data allowed in specific cells. Use custom error messages to guide users and ensure data quality. * **Dynamic Chart Titles and Axis Labels:** Automatically update chart titles and axis labels based on the selections made in slicers or form controls. This makes your visualizations more contextual and easier to understand. * **Consider using the CAMERA tool:** The CAMERA tool lets you “snapshot” ranges of cells, even charts, and link them dynamically to the source data. This allows you to build visually appealing dashboards by placing data elements precisely where you need them without disrupting the underlying spreadsheet structure.
Interactive Data Visualizations
Transform your data into compelling visuals that tell a story. Here’s how to make them interactive:
* **Dynamic Charts based on Pivot Tables:** Pivot charts are inherently linked to pivot tables, allowing you to easily drill down into different levels of detail or change the chart type based on the data being analyzed. * **Sparklines for Trend Analysis:** Use sparklines to display trends within a single cell, providing a quick visual overview of data performance over time. * **Heat Maps for Correlation Analysis:** Create heat maps using conditional formatting to identify correlations between different variables. This is particularly useful for identifying patterns in large datasets. * **Geographic Maps for Location-Based Data:** If you have location data (e.g., country, city, state), use the built-in map chart feature to visualize data geographically. * **Combination Charts for Multi-Metric Analysis:** Combine different chart types (e.g., column and line charts) to visualize multiple metrics on the same chart, providing a more comprehensive view of your data.
Advanced Data Analysis Techniques
Unlock the power of Excel’s analytical capabilities to gain deeper insights from your data.
* **Statistical Functions (TREND, FORECAST, SLOPE, INTERCEPT):** Use statistical functions to perform trend analysis, forecasting, and regression analysis. This can help you predict future outcomes based on historical data. * **What-If Analysis (Scenario Manager, Goal Seek, Data Tables):** * **Scenario Manager:** Create and compare different scenarios (e.g., optimistic, pessimistic, realistic) by changing multiple input values. * **Goal Seek:** Determine the input value needed to achieve a specific target output. * **Data Tables:** Analyze the impact of changing one or two input variables on a formula. * **Power Query for Data Transformation and Loading:** Use Power Query to connect to various data sources (e.g., databases, web pages, text files), clean and transform data, and load it into Excel. This is especially useful for automating data import and preparation tasks. * **Power Pivot for Data Modeling and Analysis:** Use Power Pivot to create data models with multiple tables and relationships. This allows you to analyze large datasets and create complex calculations using DAX (Data Analysis Expressions). * **Arrays:** Create and use arrays to perform more complex calculations than regular formulas allow. This can be useful for tasks such as calculating weighted averages or performing matrix operations.
Examples of Advanced Templates
* **Project Management Dashboard:** Track project progress, milestones, and resource allocation with interactive charts and Gantt charts. * **Sales Performance Analysis:** Analyze sales data by region, product, and sales representative, with dynamic dashboards and interactive reports. * **Financial Modeling Template:** Develop sophisticated financial models for forecasting revenue, expenses, and profitability, with scenario analysis and sensitivity analysis. * **HR Analytics Dashboard:** Track employee demographics, performance metrics, and turnover rates, with interactive dashboards and charts. * **Inventory Management System:** Manage inventory levels, track stock movements, and generate reports on stock availability and reorder points.
Tips for Building Effective Templates
* **Plan Your Template Carefully:** Define the purpose of the template, the data inputs, and the desired outputs before you start building. * **Use Clear and Consistent Formatting:** Apply consistent formatting to make your template easy to read and understand. * **Protect Your Formulas:** Protect the cells containing formulas to prevent accidental changes. * **Provide Clear Instructions:** Include clear instructions on how to use the template. * **Test Thoroughly:** Test your template thoroughly to ensure that it works as expected. * **Document Your Template:** Create documentation describing the template’s purpose, functionality, and usage instructions. * **Use Named Ranges:** Named ranges help improve the readability and maintainability of your formulas. Instead of referring to cells like “A1:A10”, you can use a descriptive name like “SalesData”. By incorporating these advanced techniques into your Excel templates, you can create powerful tools that not only streamline your workflow but also provide deeper insights and improve decision-making. Don’t be afraid to experiment and push the boundaries of what’s possible with Excel!
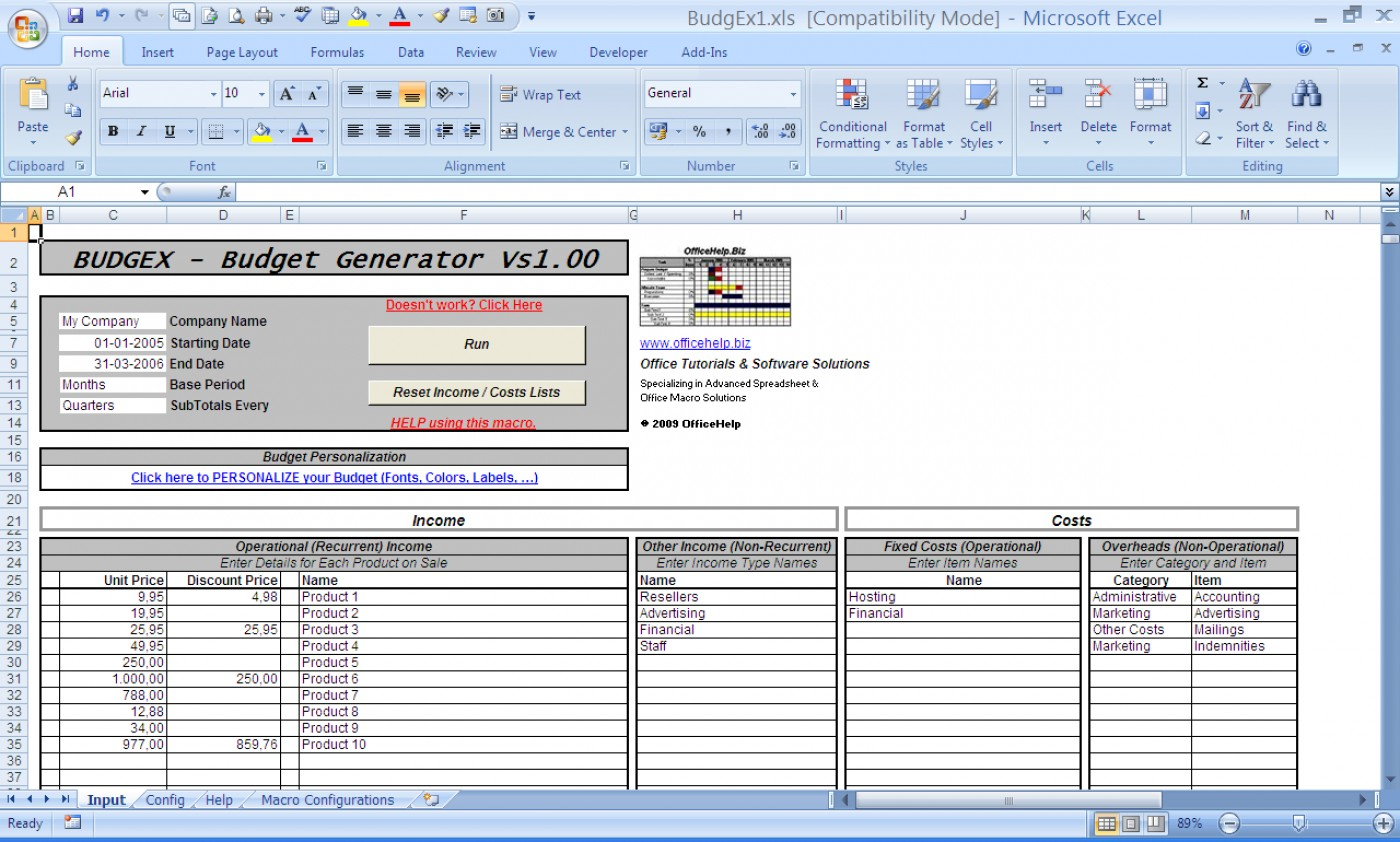 1400×842 advanced excel spreadsheets intended template ideas microsoft from db-excel.com
 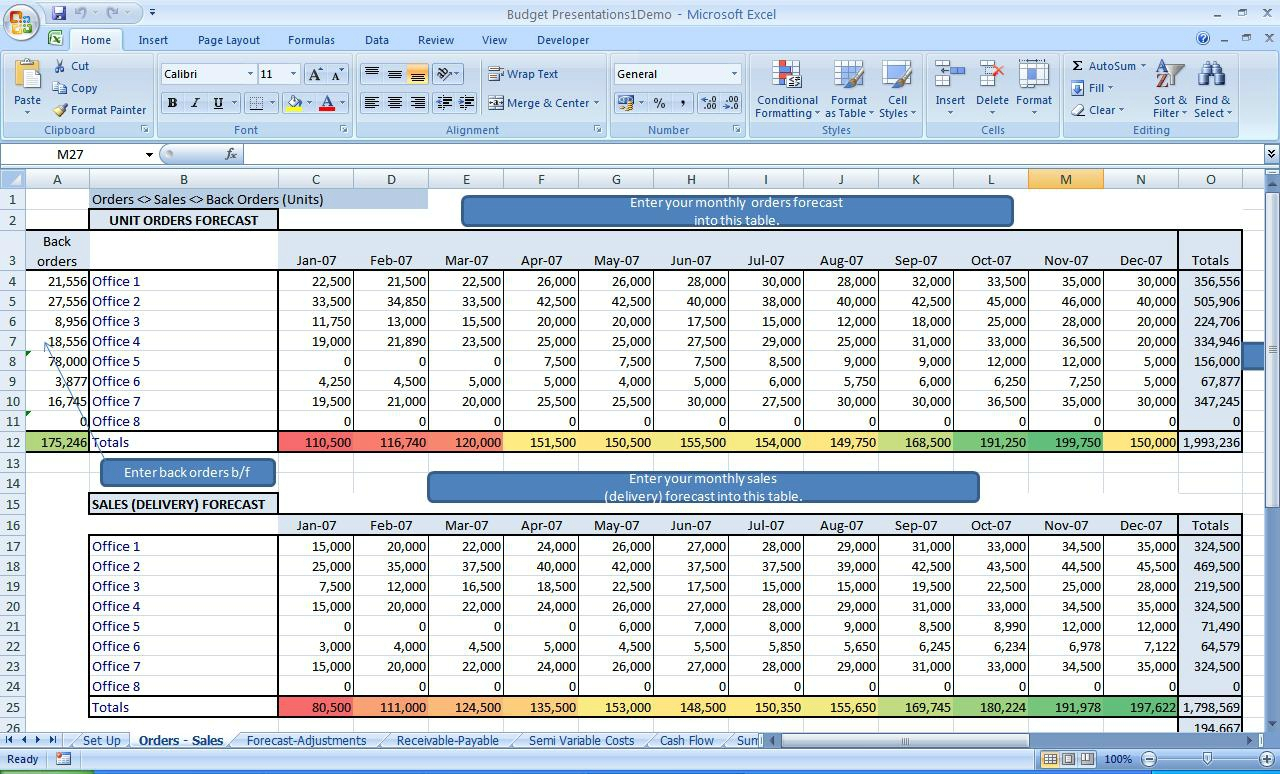 1280×774 advanced excel spreadsheets advanced excel spreadsheet templates from db-excel.com
 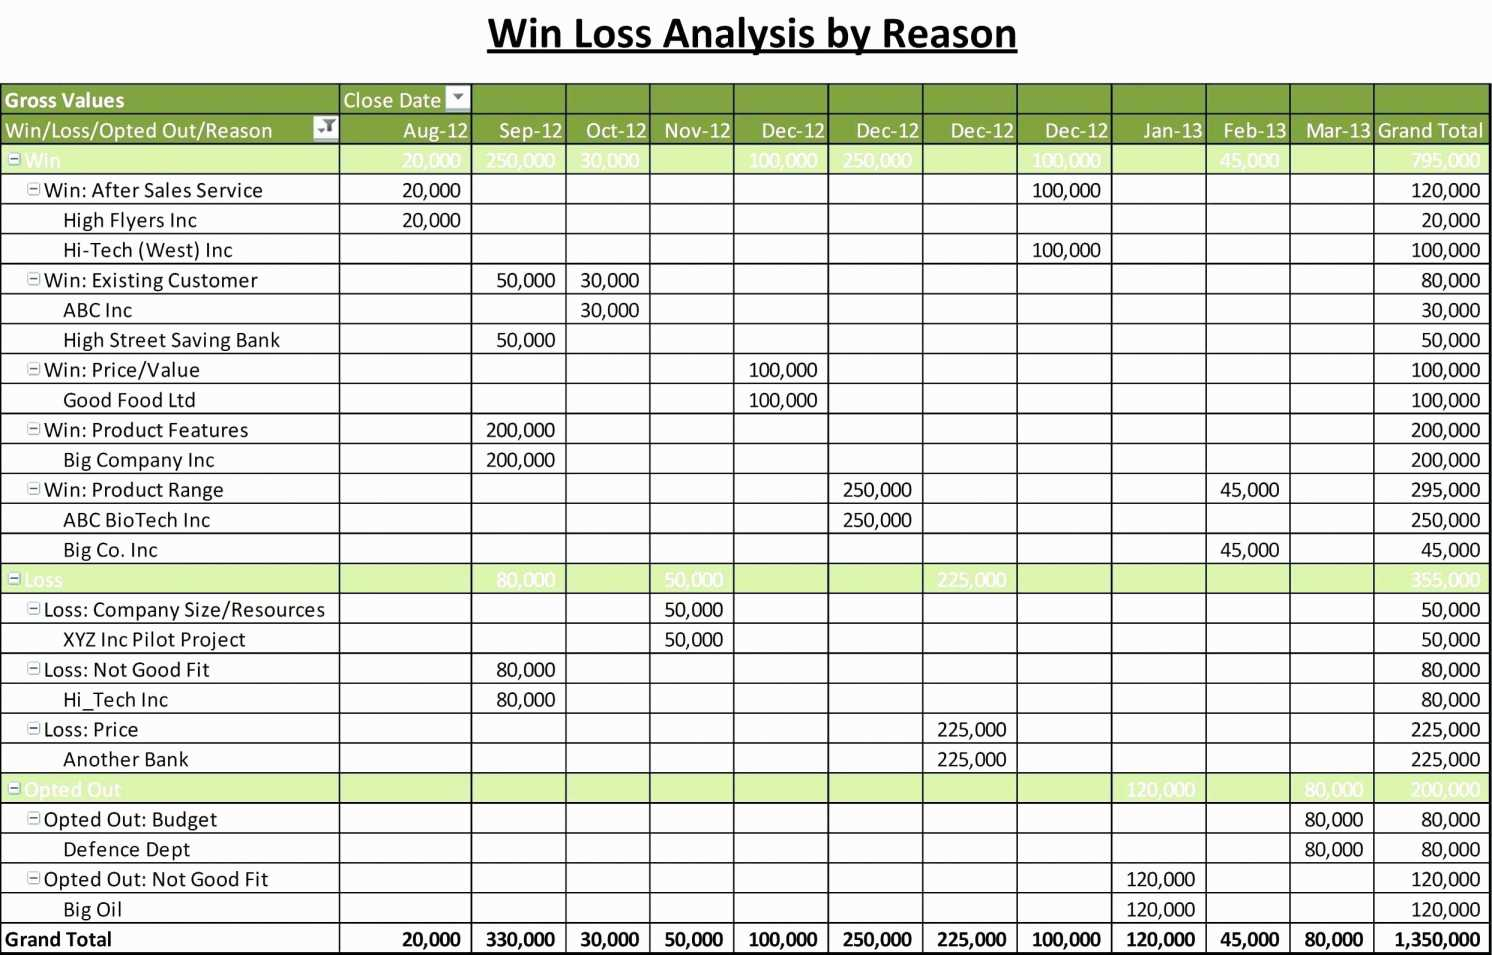 1492×955 advanced excel spreadsheet templates advanced excel template from db-excel.com
 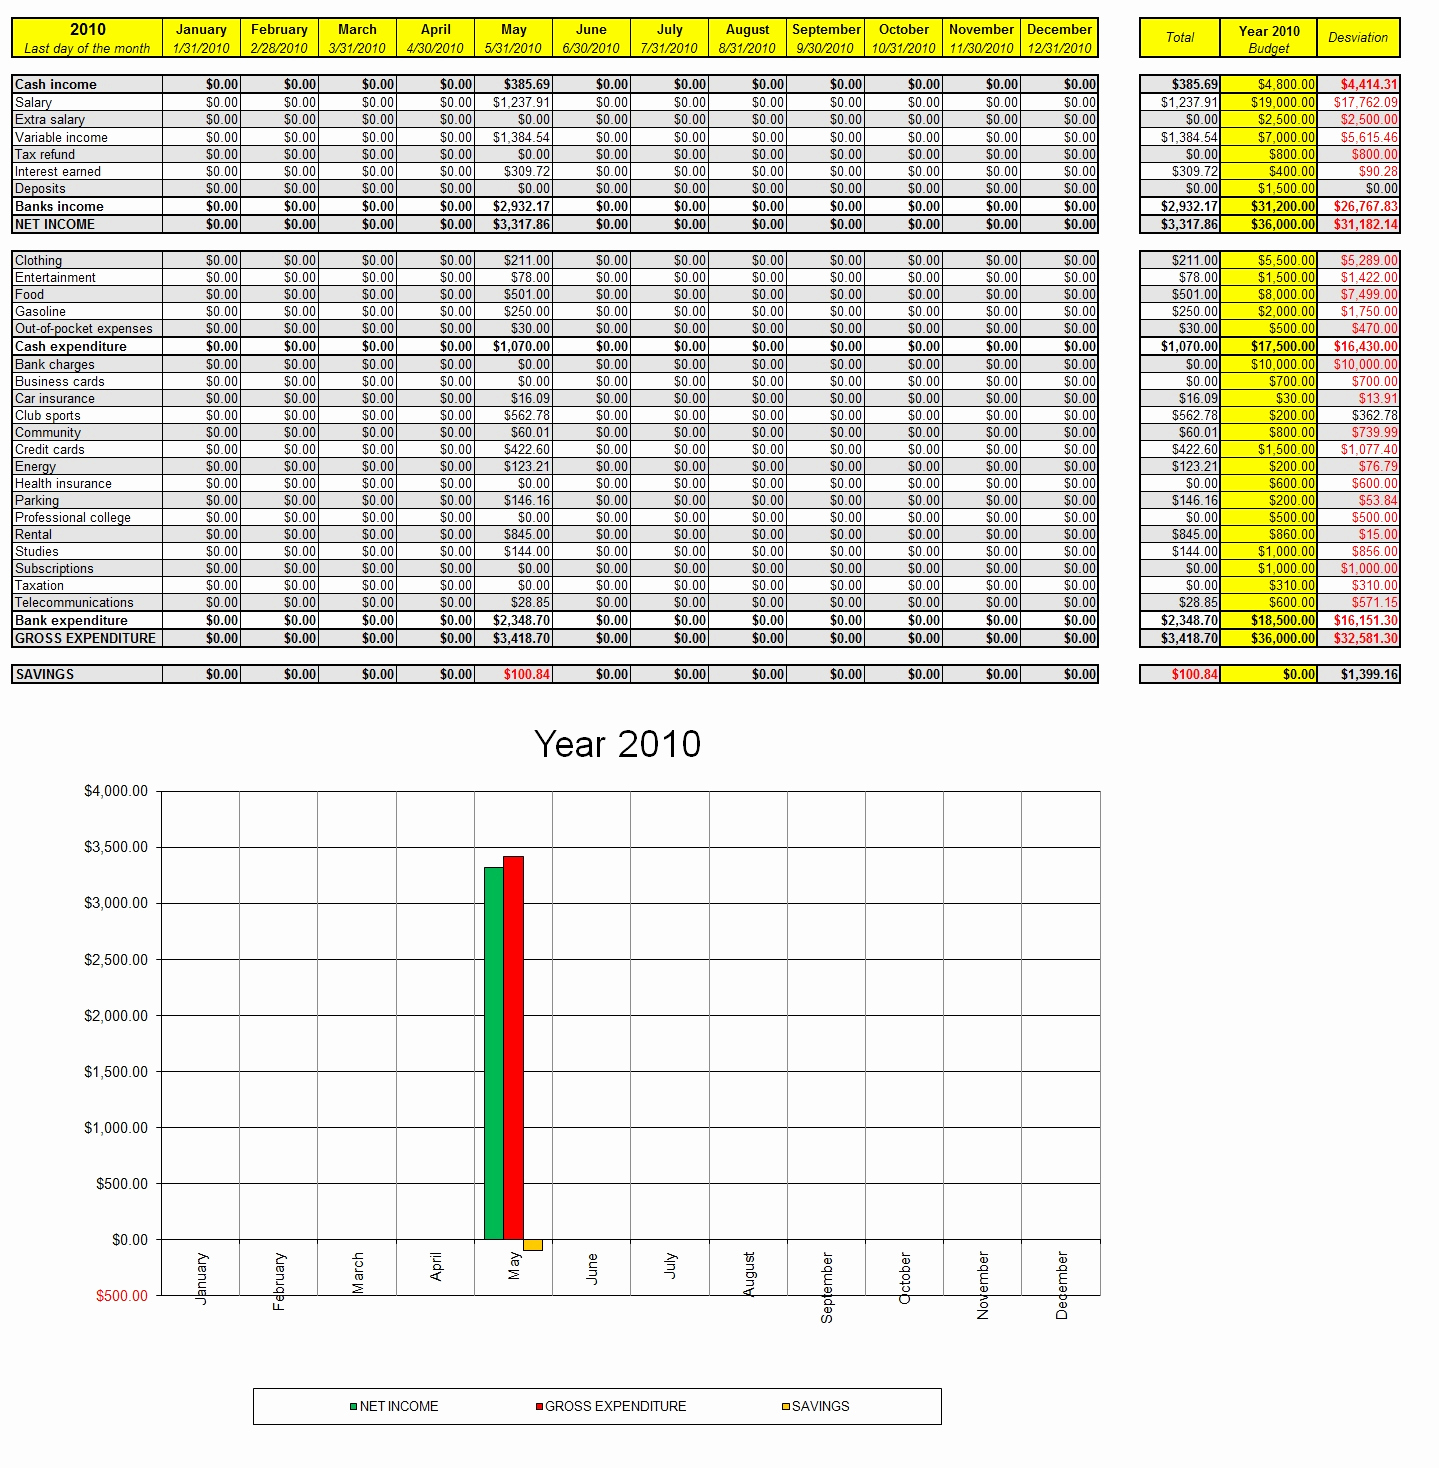 1439×1468 fresh advanced excel spreadsheet templates document ideas from db-excel.com
 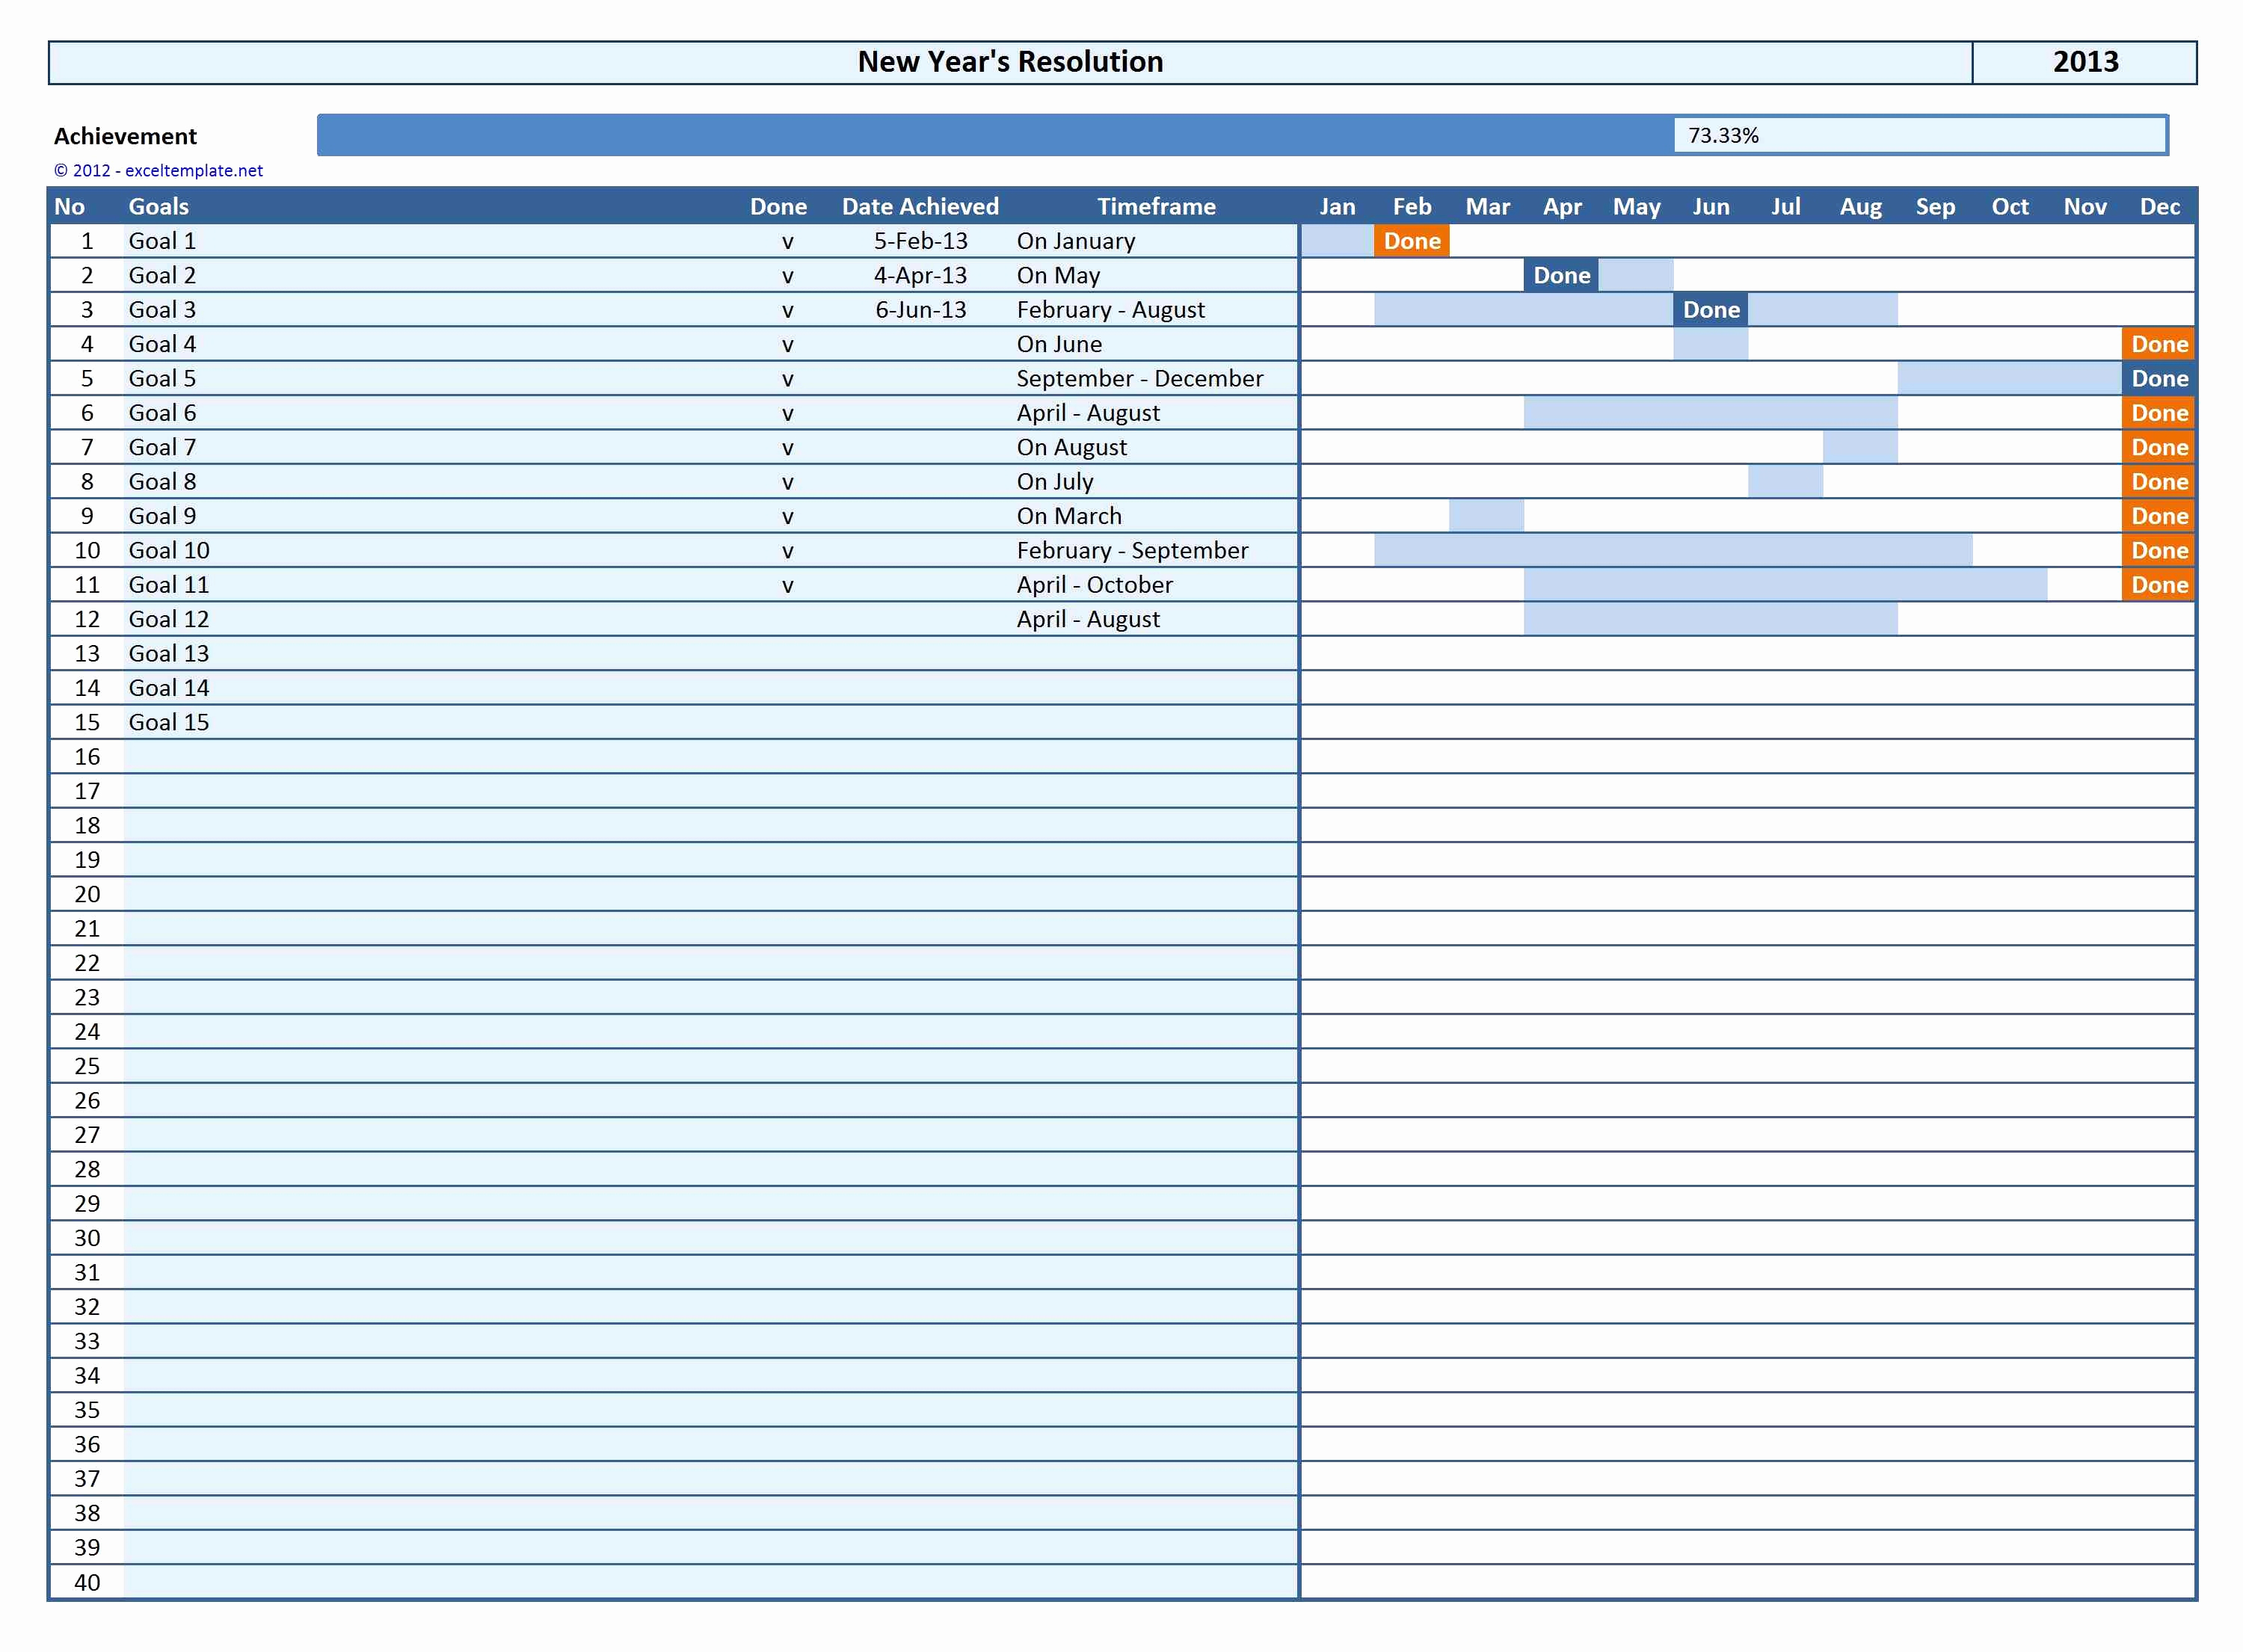 3000×2210 advanced excel spreadsheet templates beautiful advanced excel from db-excel.com
 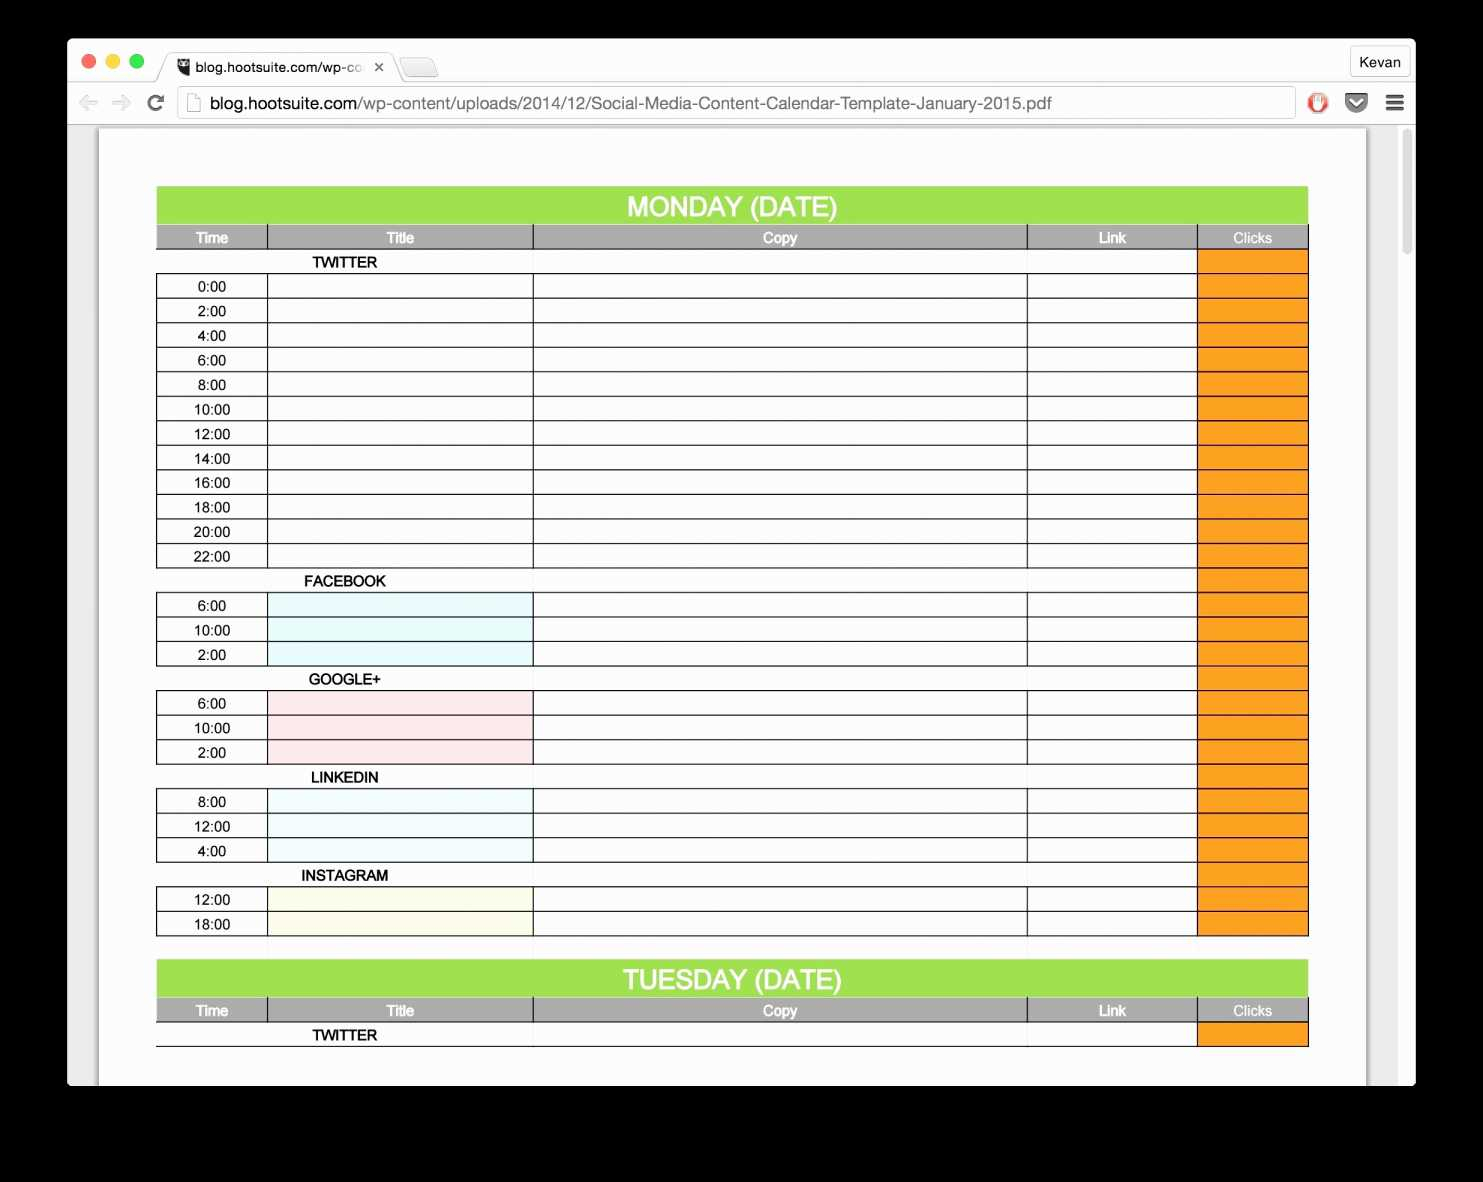 1483×1182 advanced excel spreadsheet templates lovely advanced excel from db-excel.com
 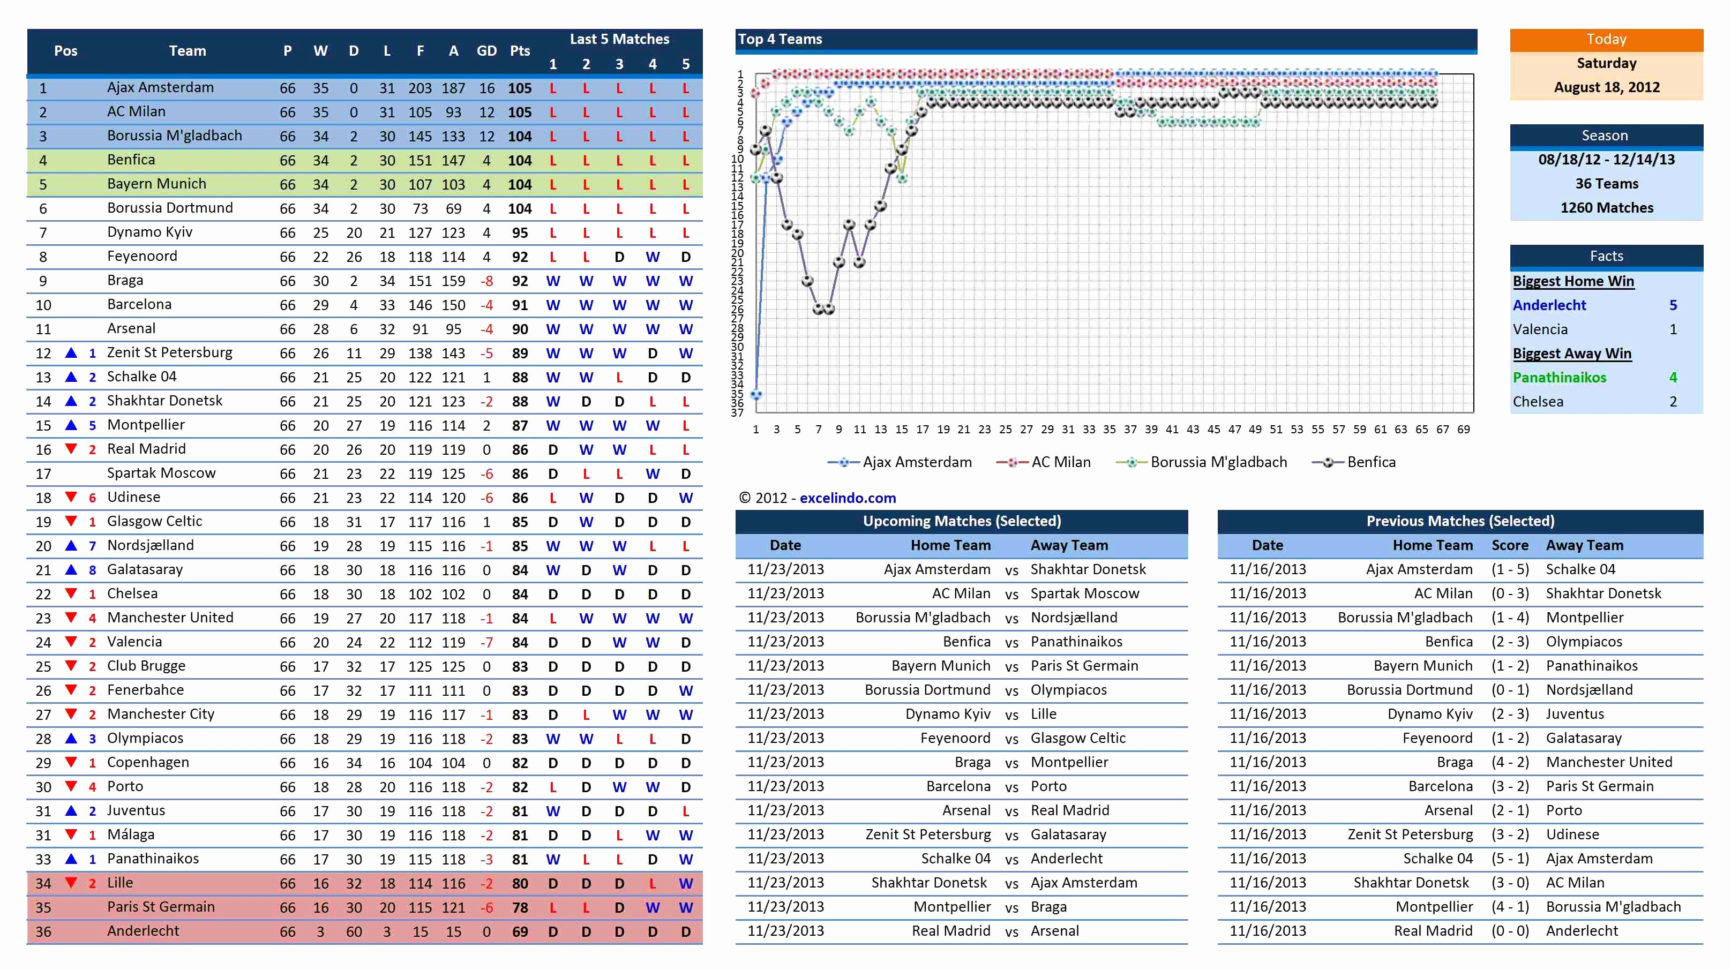 1731×970 advanced excel spreadsheet templates unique advanced excel advanced from db-excel.com
 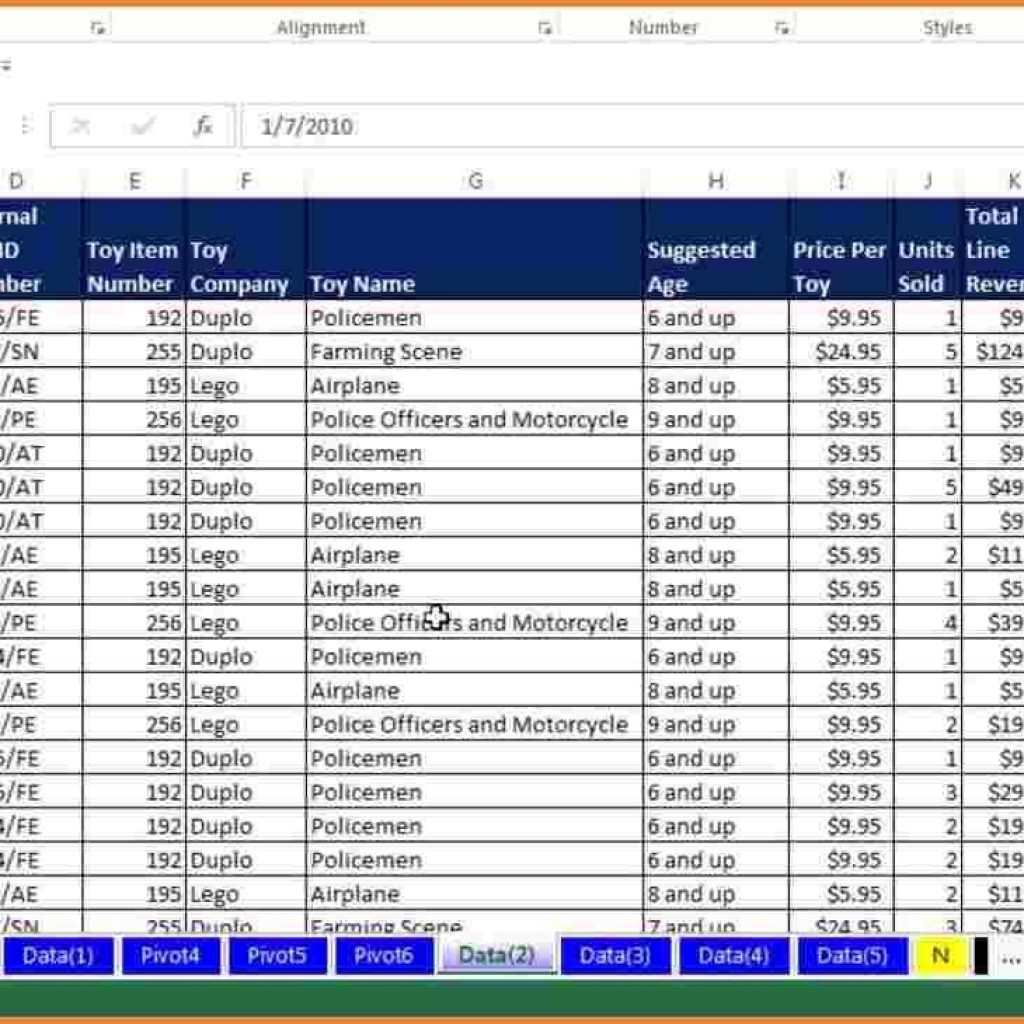 1024×1024 advanced excel spreadsheets db excelcom from db-excel.com
 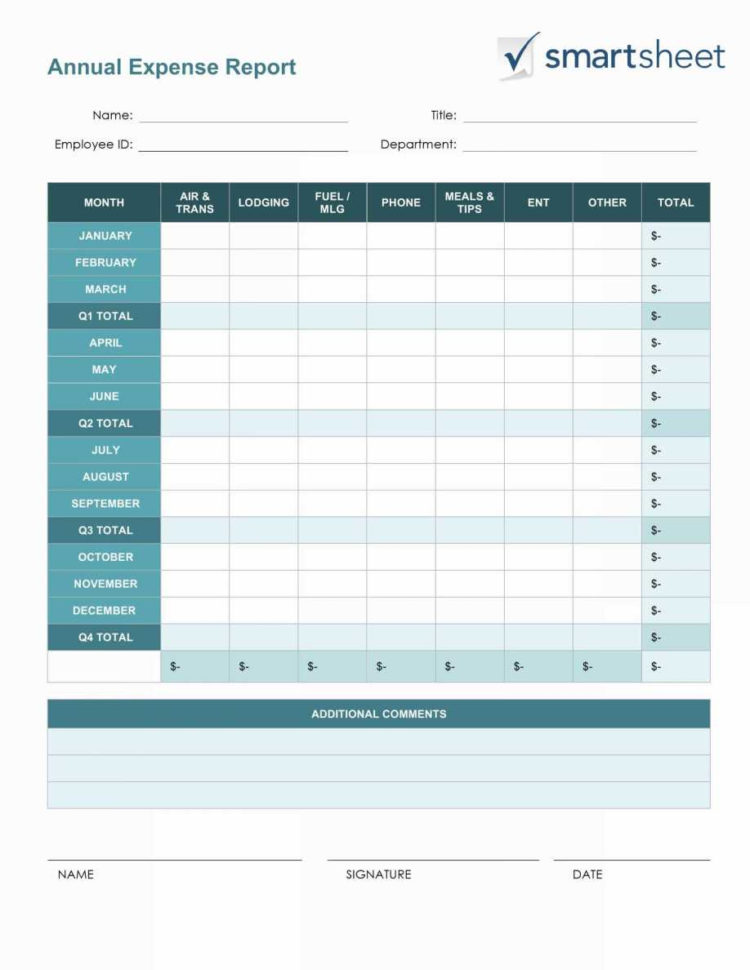 750×970 advanced excel spreadsheet templates db excelcom from db-excel.com
 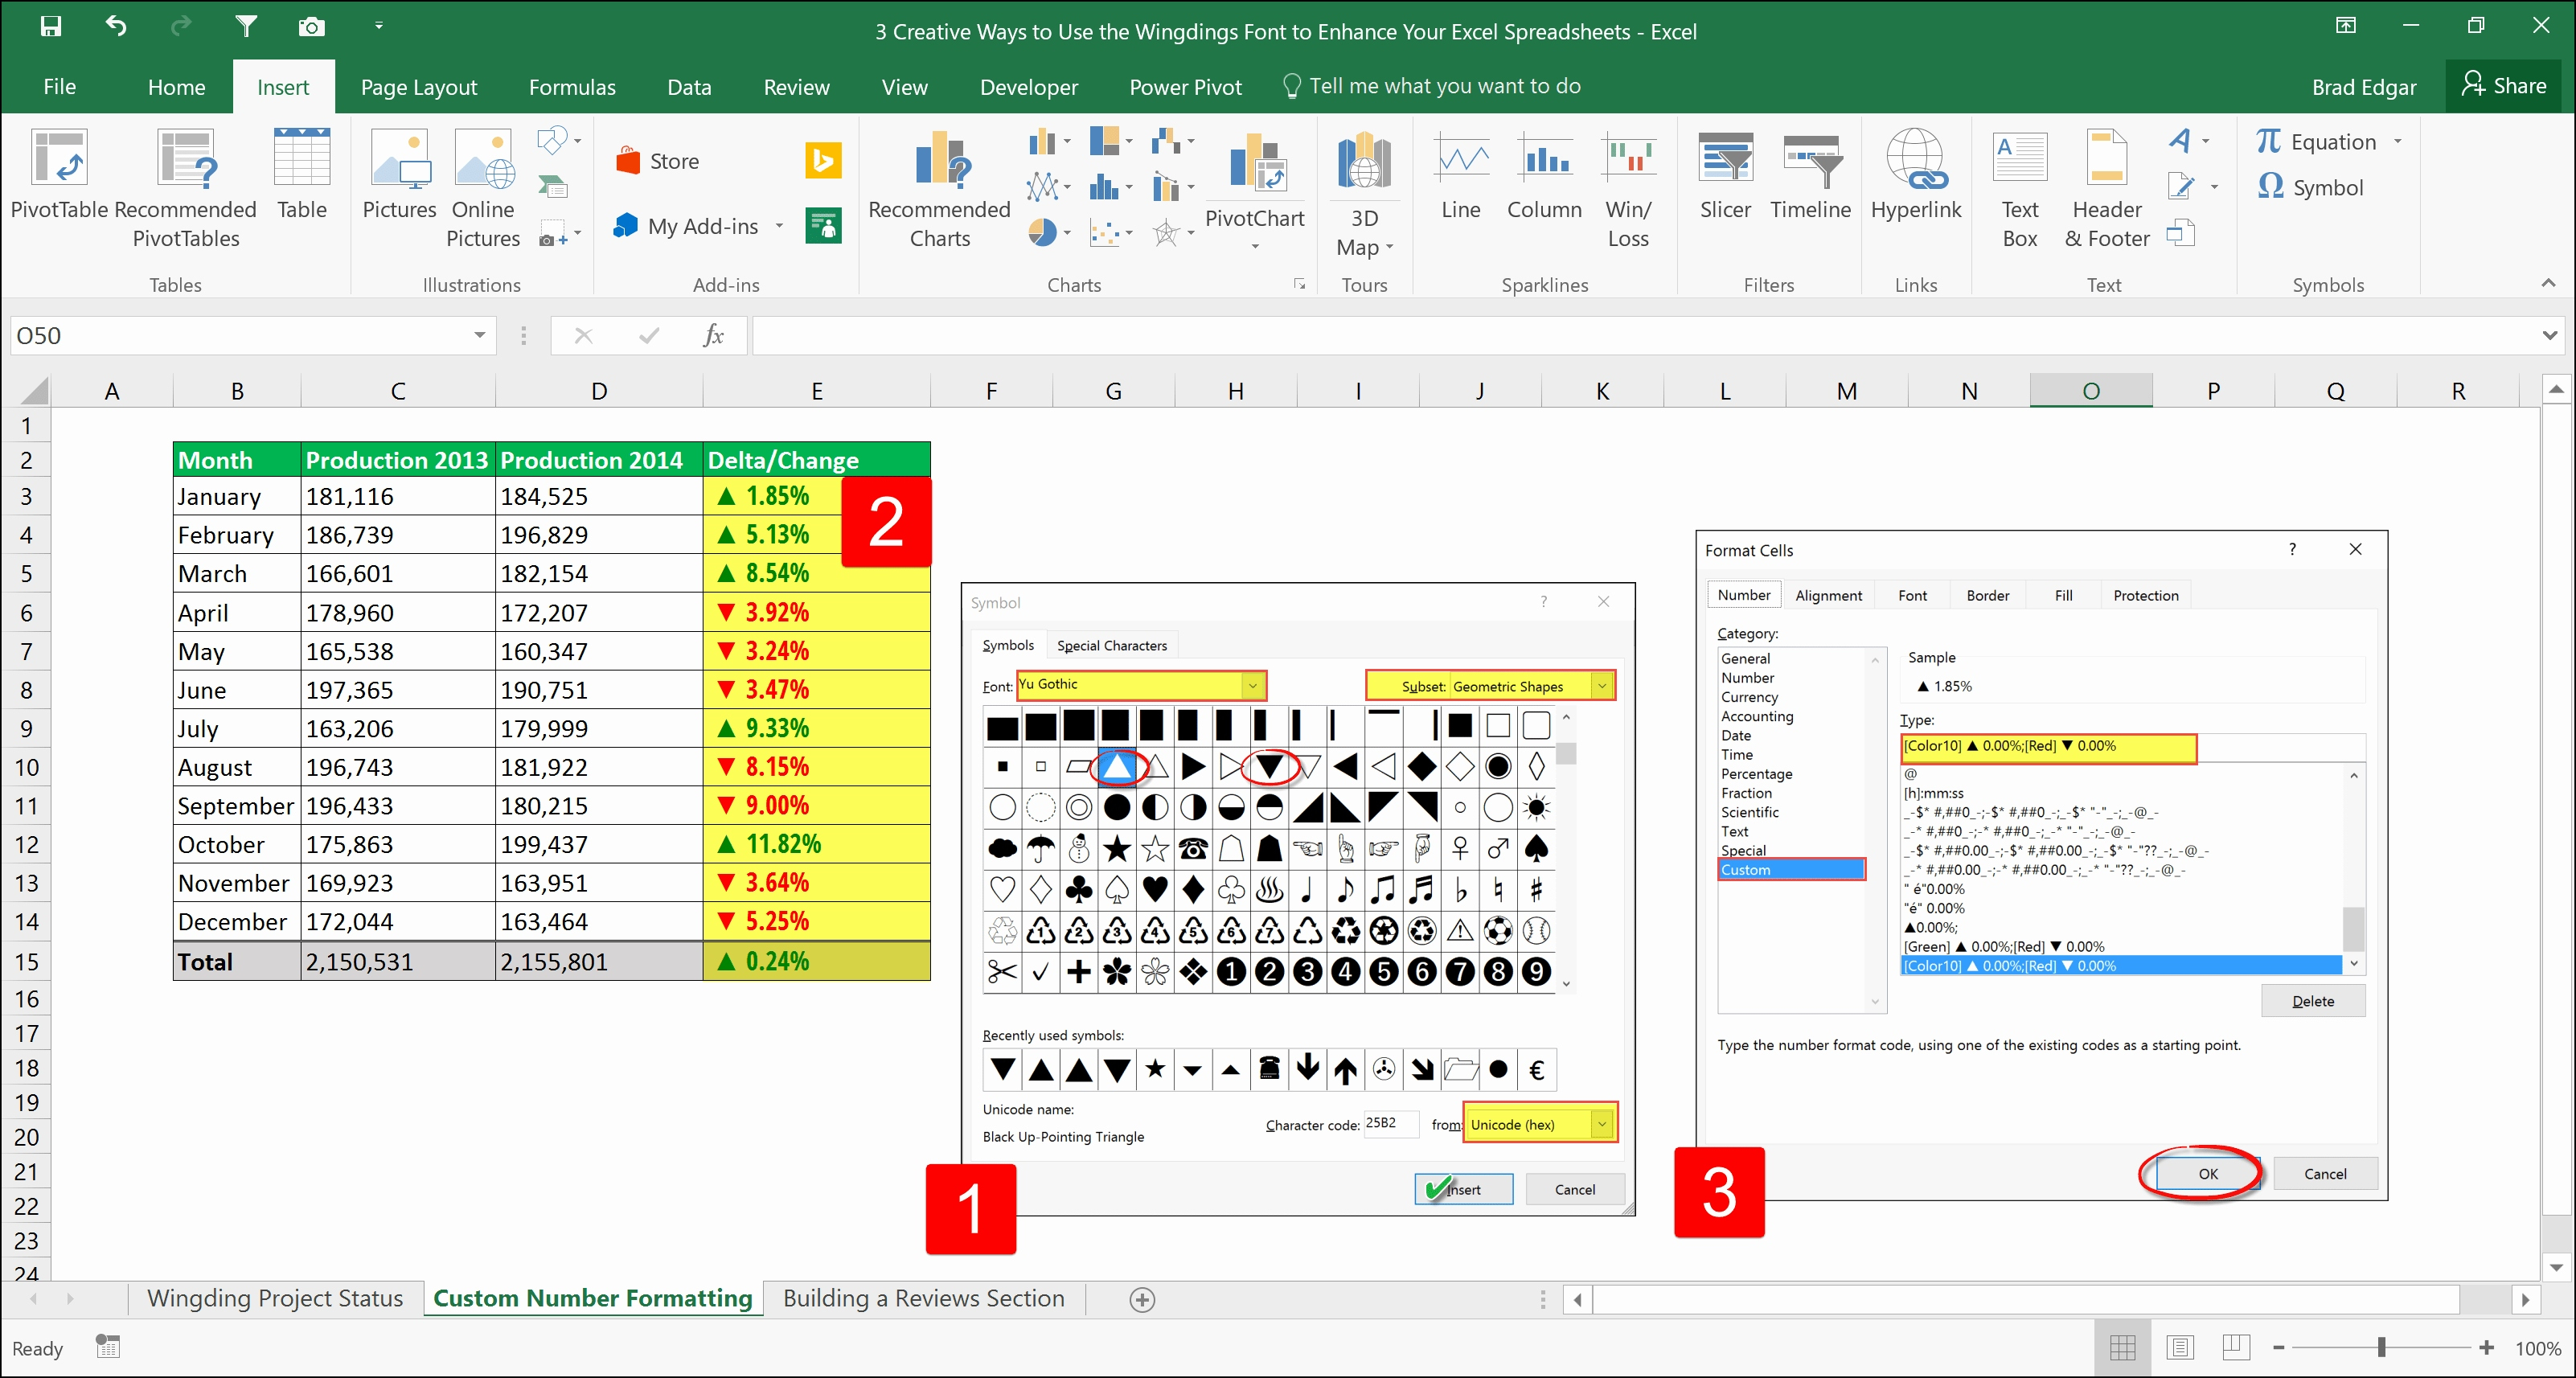 3204×1714 advanced excel spreadsheets resourcesaver advanced excel from db-excel.com
  680×474 create basic advance excel template fiverr from www.fiverr.com
 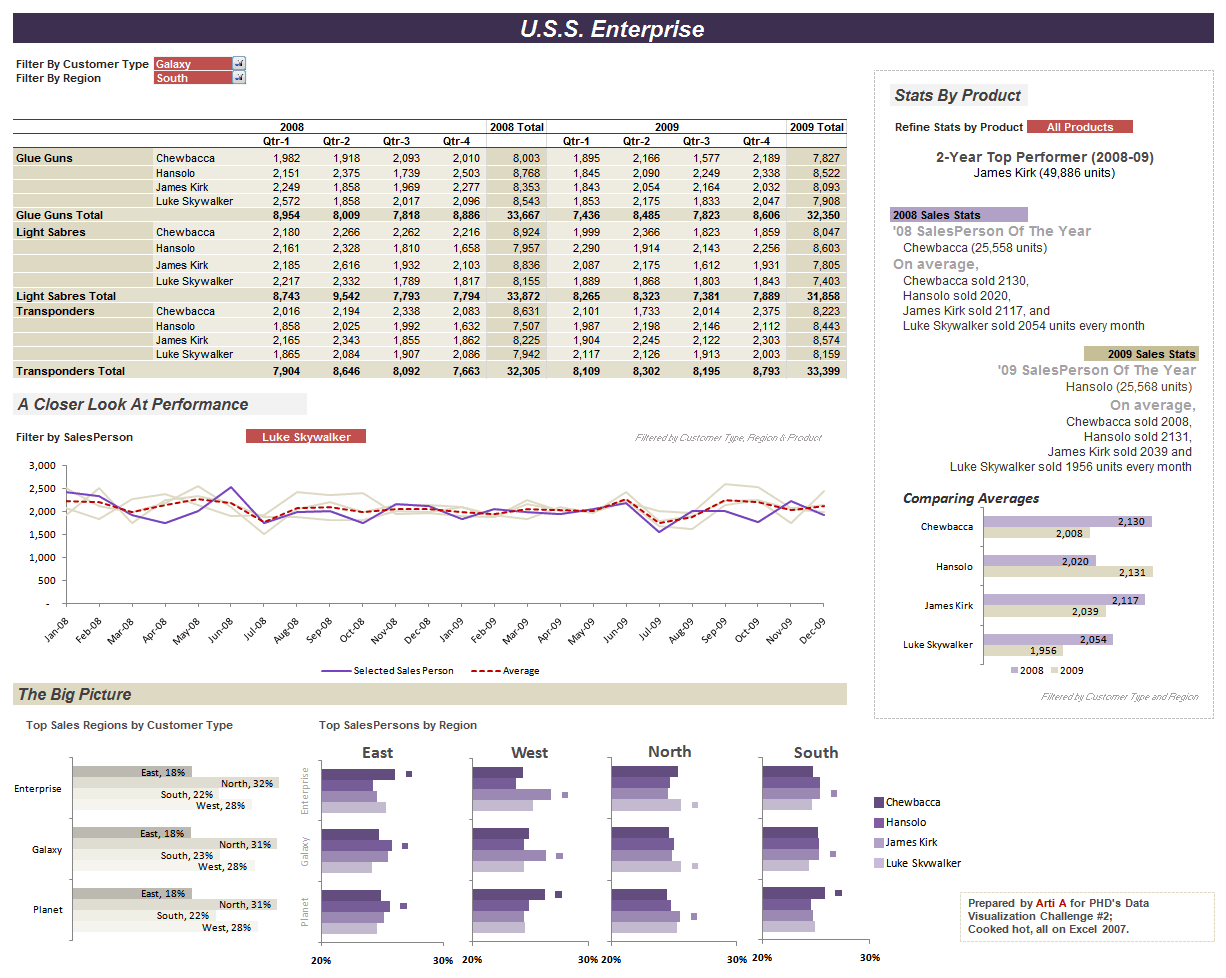 1226×978 advanced excel spreadsheet templates excelxocom from excelxo.com
 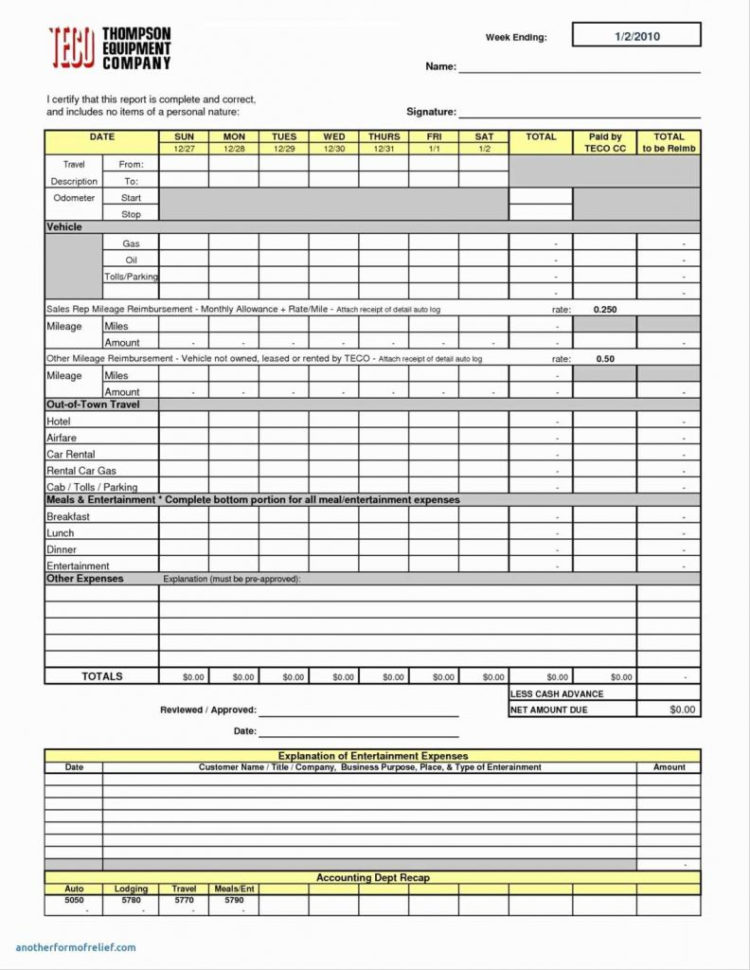 750×970 advanced excel spreadsheet advanced sample excel spreadsheets from db-excel.com
  768×768 advanced excel spreadsheets excel spreadsheet templates from db-excel.com
  1255×970 advanced excel spreadsheet templates microsoft spreadsheet template from db-excel.com
 Thank you for visiting Advanced Excel Template Ideas. There are a lot of beautiful templates out there, but it can be easy to feel like a lot of the best cost a ridiculous amount of money, require special design. And if at this time you are looking for information and ideas regarding the Advanced Excel Template Ideas then, you are in the perfect place. Get this Advanced Excel Template Ideas for free here. We hope this post Advanced Excel Template Ideas inspired you and help you what you are looking for.
Advanced Excel Template Ideas was posted in August 11, 2025 at 5:17 pm. If you wanna have it as yours, please click the Pictures and you will go to click right mouse then Save Image As and Click Save and download the Advanced Excel Template Ideas Picture.. Don’t forget to share this picture with others via Facebook, Twitter, Pinterest or other social medias! we do hope you'll get inspired by SampleTemplates123... Thanks again! If you have any DMCA issues on this post, please contact us!