Downloadable Excel Gantt Chart Template With Color Codes
Downloadable Excel Gantt Chart Template with Color Codes
Project management is crucial for the successful completion of any endeavor, big or small. A Gantt chart is a powerful visual tool that helps project managers plan, schedule, and track tasks, ensuring projects stay on time and within budget. This article focuses on a downloadable Excel Gantt chart template with color codes, highlighting its benefits and how to effectively use it for efficient project management.
What is a Gantt Chart?
A Gantt chart is a type of bar chart that illustrates a project schedule. It lists project tasks on the vertical axis and time intervals on the horizontal axis. Each task is represented by a horizontal bar, the length of which corresponds to its duration. Gantt charts provide a clear overview of project timelines, task dependencies, and resource allocation.
Why Use an Excel Gantt Chart Template?
While dedicated project management software offers advanced features, an Excel Gantt chart template provides a cost-effective and accessible solution for many projects, particularly smaller ones. Here’s why you might choose an Excel template:
- Cost-Effective: Excel is often already available on many computers, eliminating the need to purchase expensive project management software.
- Accessibility: Most people are familiar with Excel, making it easy to learn and use. The template provides a pre-formatted structure, simplifying the process of creating a Gantt chart.
- Customizability: Excel allows for easy customization to fit specific project needs. You can adjust colors, add columns, and modify formulas to tailor the chart to your requirements.
- Ease of Sharing: Excel files can be easily shared with team members, stakeholders, and clients.
Benefits of Color-Coded Gantt Charts
Adding color codes to your Gantt chart provides an extra layer of visual information, making it easier to interpret and manage project progress. Here are some benefits:
- Improved Visual Clarity: Colors help to differentiate tasks based on their status, priority, or assigned team member. This makes it easier to quickly grasp the project’s overall status.
- Enhanced Task Prioritization: Use colors to highlight critical tasks that are essential for project success. This helps the team focus on the most important activities.
- Better Progress Tracking: Assign colors to indicate task completion status (e.g., “In Progress,” “Completed,” “Delayed”). This allows for quick identification of potential bottlenecks or delays.
- Improved Communication: Color codes can be used to communicate project status updates to stakeholders in a clear and concise manner.
- Resource Management: Assign different colors to different team members to visualize their workload and identify potential resource constraints.
Key Features of the Downloadable Excel Gantt Chart Template
The downloadable Excel Gantt chart template typically includes the following features:
- Task List: A dedicated column for listing all project tasks, typically with subtasks or a work breakdown structure (WBS) capability.
- Start Date: A column for specifying the start date of each task.
- End Date: A column for specifying the end date of each task.
- Duration: A calculated column that automatically determines the duration of each task based on the start and end dates.
- Dependencies: A column to indicate task dependencies (e.g., task A must be completed before task B can start). This is often managed through formula or conditional formatting.
- Progress: A column to track the percentage completion of each task.
- Color Codes: Pre-defined color codes for different task statuses, priorities, or resource assignments.
- Gantt Chart Visualization: A visual representation of the project schedule, with bars indicating the duration of each task. The length of the bar corresponds to the duration, and its position on the timeline indicates the start and end dates.
- Automatic Updates: The Gantt chart automatically updates as you enter or modify task information.
- Legend: A key explaining the meaning of each color code.
How to Use the Excel Gantt Chart Template
Follow these steps to effectively use the downloadable Excel Gantt chart template:
- Download and Open the Template: Download the Excel Gantt chart template from a reliable source. Open the file in Microsoft Excel.
- Customize the Template: Review the template and customize it to fit your project’s needs. This may involve adding or removing columns, adjusting color codes, and modifying formulas.
- Enter Task Information: Populate the task list with all the tasks required for your project. Enter the start date, end date, duration, and dependencies for each task.
- Assign Color Codes: Assign color codes to each task based on its status, priority, or assigned team member. Refer to the legend for the meaning of each color.
- Track Progress: Regularly update the progress column to reflect the current status of each task. This will automatically update the Gantt chart visualization.
- Analyze the Gantt Chart: Use the Gantt chart to monitor project progress, identify potential delays, and make necessary adjustments to the schedule.
- Share the Chart: Share the Gantt chart with your team members, stakeholders, and clients to keep them informed of project progress.
Tips for Effective Gantt Chart Management
Here are some tips for managing your Gantt chart effectively:
- Keep it Simple: Avoid overcrowding the chart with too much information. Focus on the most important tasks and milestones.
- Regularly Update: Keep the Gantt chart updated with the latest information. This will ensure that it remains an accurate reflection of the project’s progress.
- Communicate Effectively: Use the Gantt chart as a communication tool to keep everyone informed of project status.
- Be Flexible: Be prepared to adjust the Gantt chart as the project evolves. Unexpected events may require changes to the schedule.
- Use Dependencies Wisely: Accurately define task dependencies to ensure that tasks are completed in the correct order.
- Consider Milestones: Incorporate milestones into your Gantt chart to mark significant achievements and track progress against key goals.
Conclusion
A downloadable Excel Gantt chart template with color codes provides a valuable tool for project managers. Its cost-effectiveness, accessibility, and customizability make it a suitable option for a variety of projects. By effectively utilizing the template and incorporating color codes, you can improve visual clarity, enhance task prioritization, and track project progress more efficiently, ultimately increasing the likelihood of project success. Remember to keep the chart updated, communicate effectively, and be prepared to adapt as the project progresses.
 1024×768 gantt chart excel template db excelcom from db-excel.com
 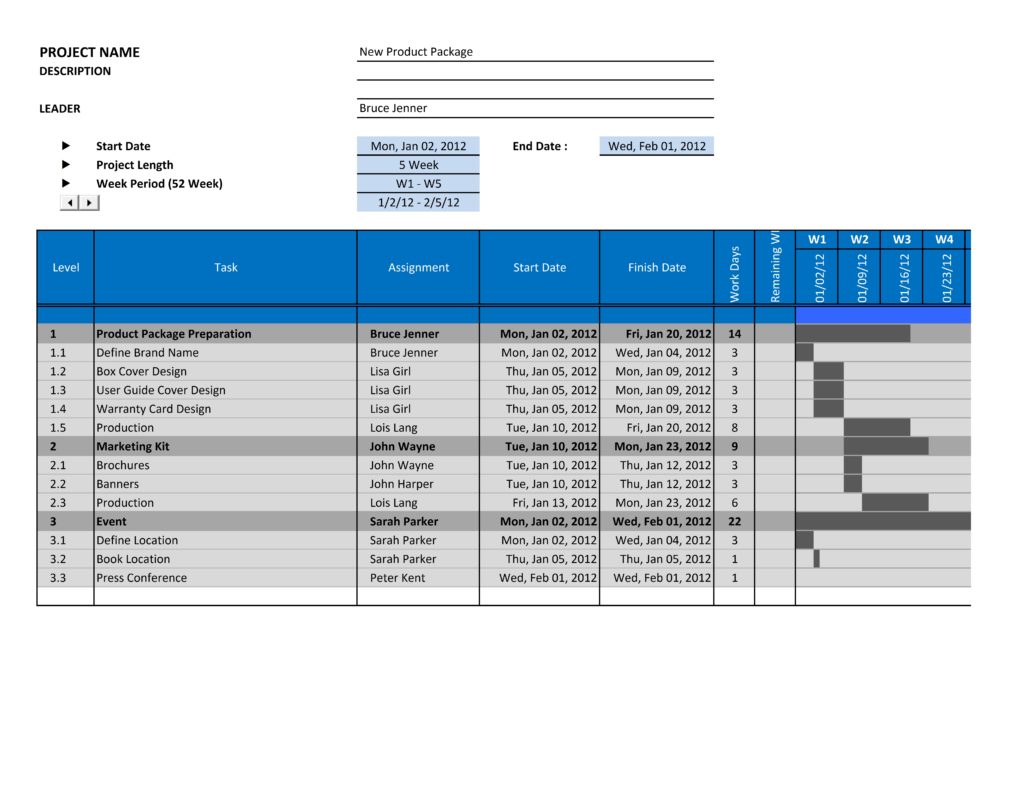 1024×791 excel sheet gantt chart template db excelcom from db-excel.com
 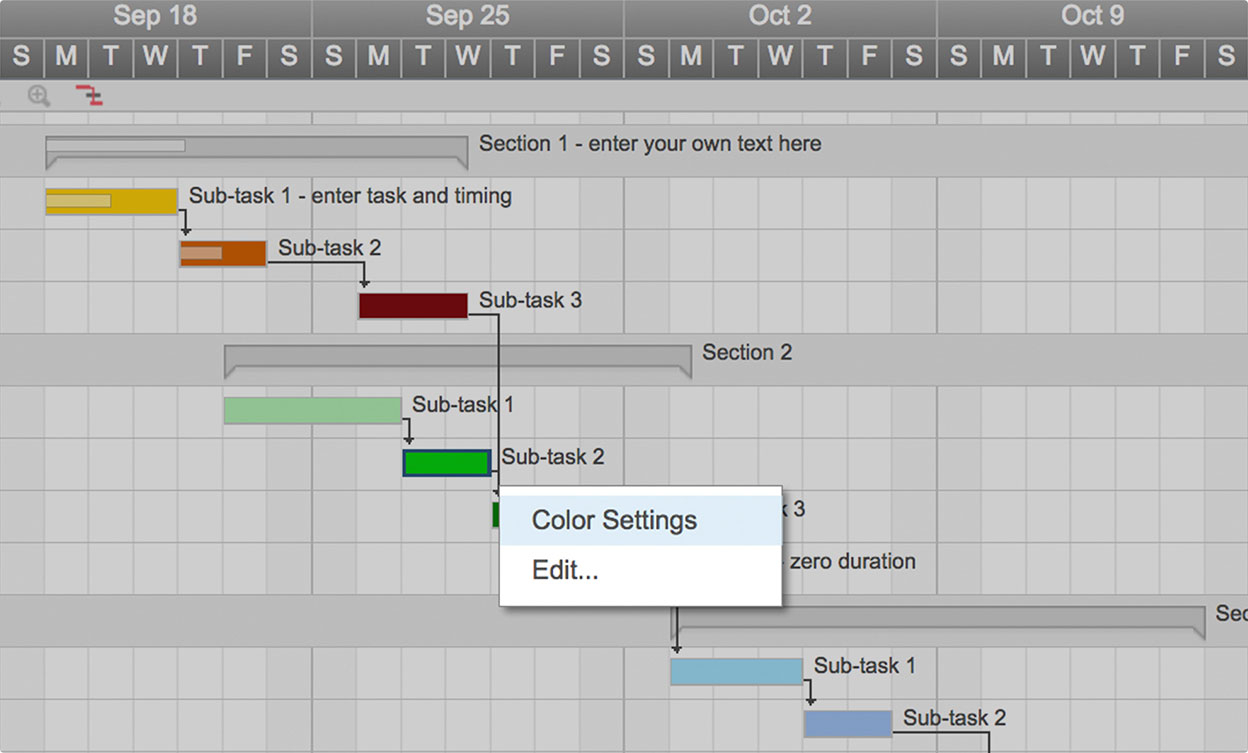 1248×753 gantt chart excel template gantt chart from db-excel.com
 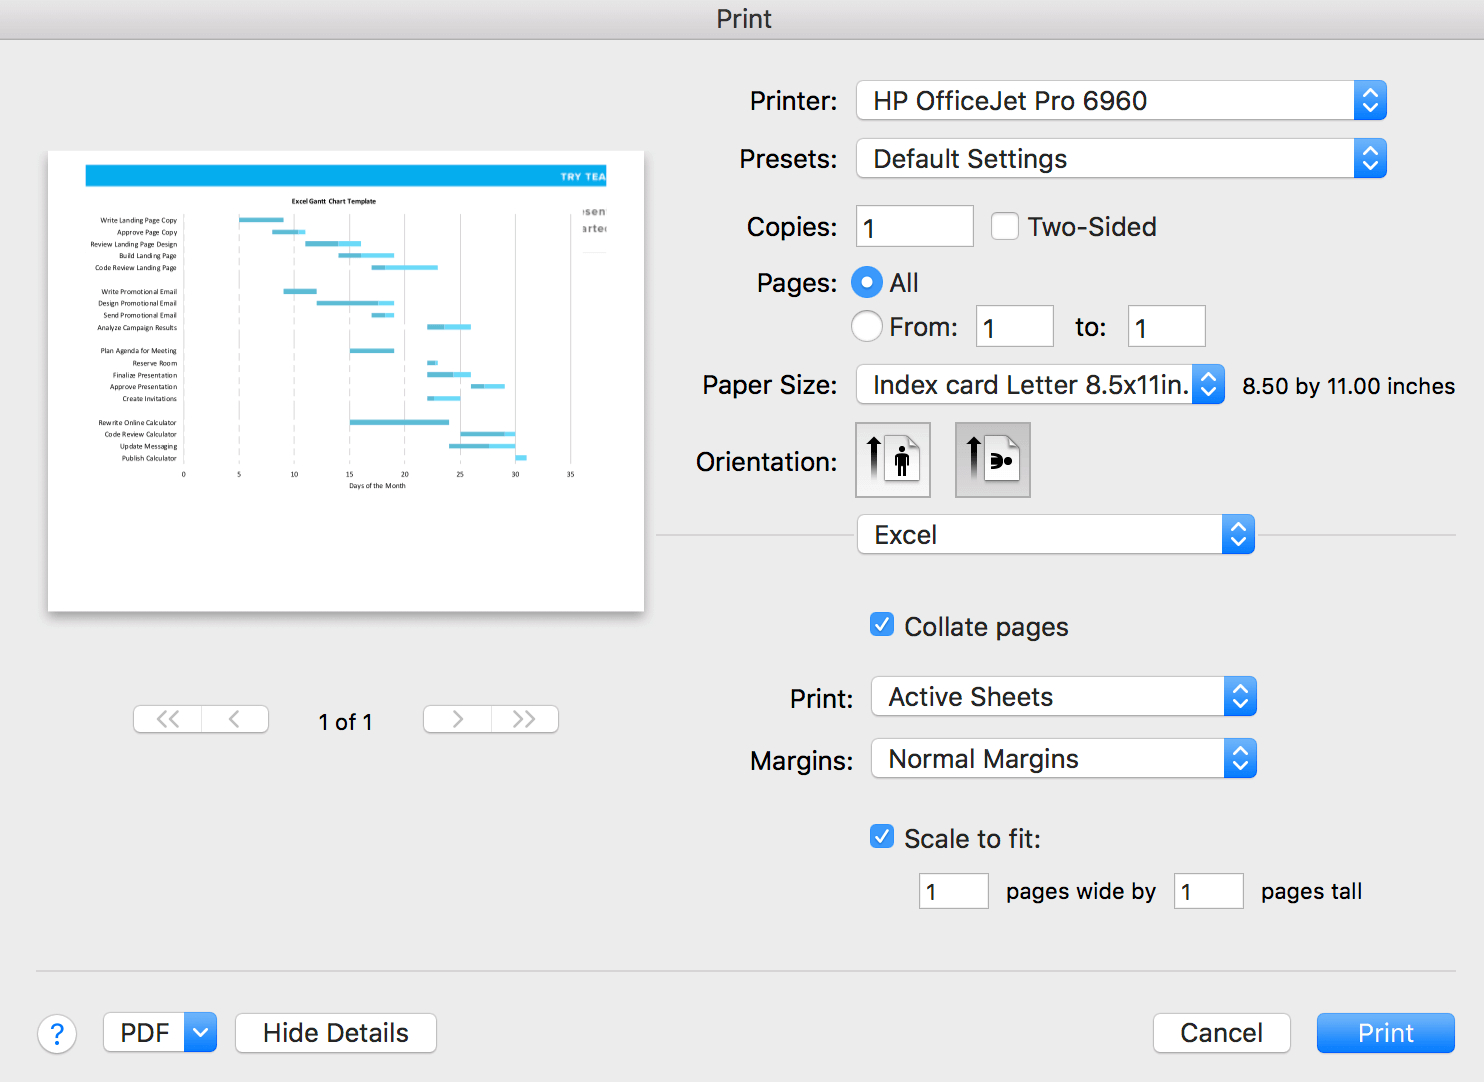 1484×1082 gantt chart excel template teamgantt excel from db-excel.com
 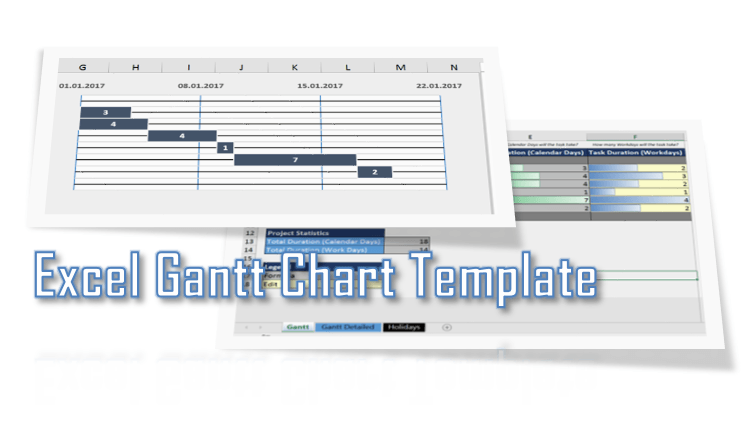 753×439 excel gantt chart template analyst cave from analystcave.com
 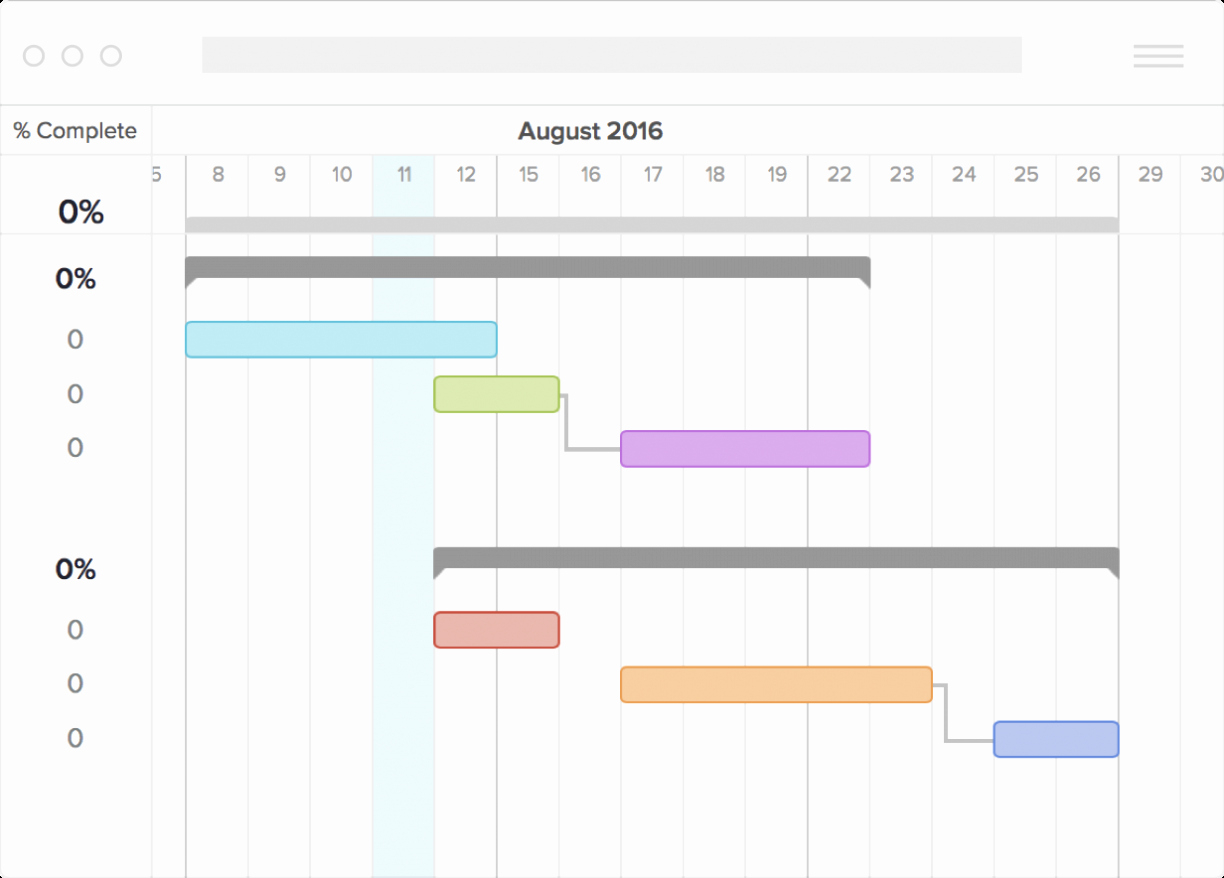 1224×878 gantt chart excel template inspirational microsoft excel from db-excel.com
 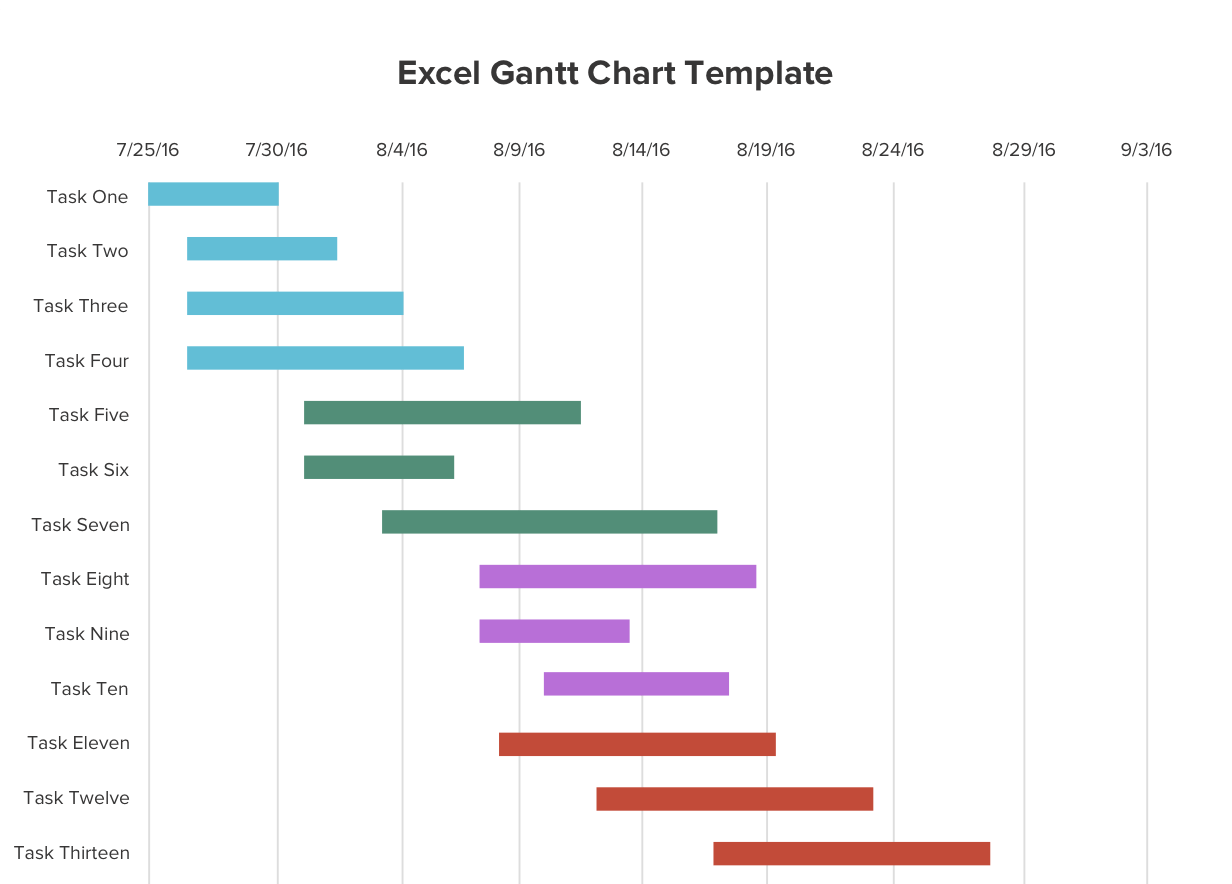 0 x 0 gantt chart excel template teamgantt from www.teamgantt.com
 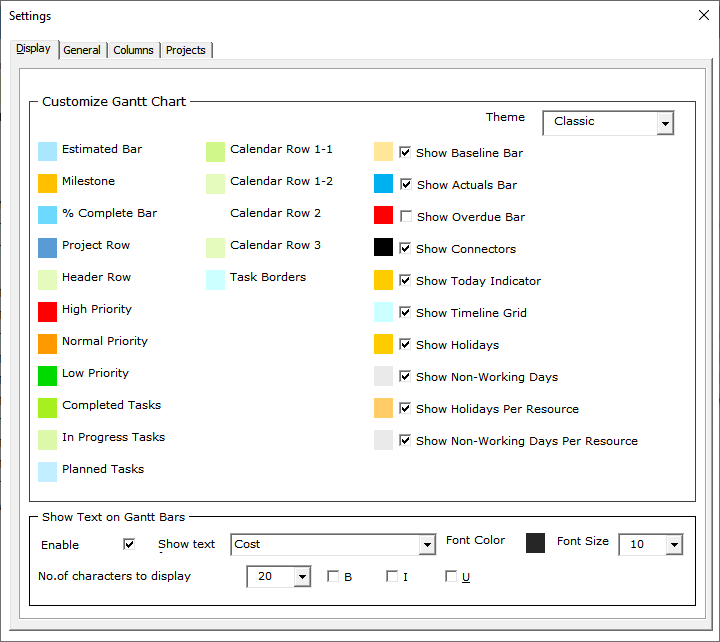 720×642 customizing gantt chart timeline colors gantt excel from www.ganttexcel.com
 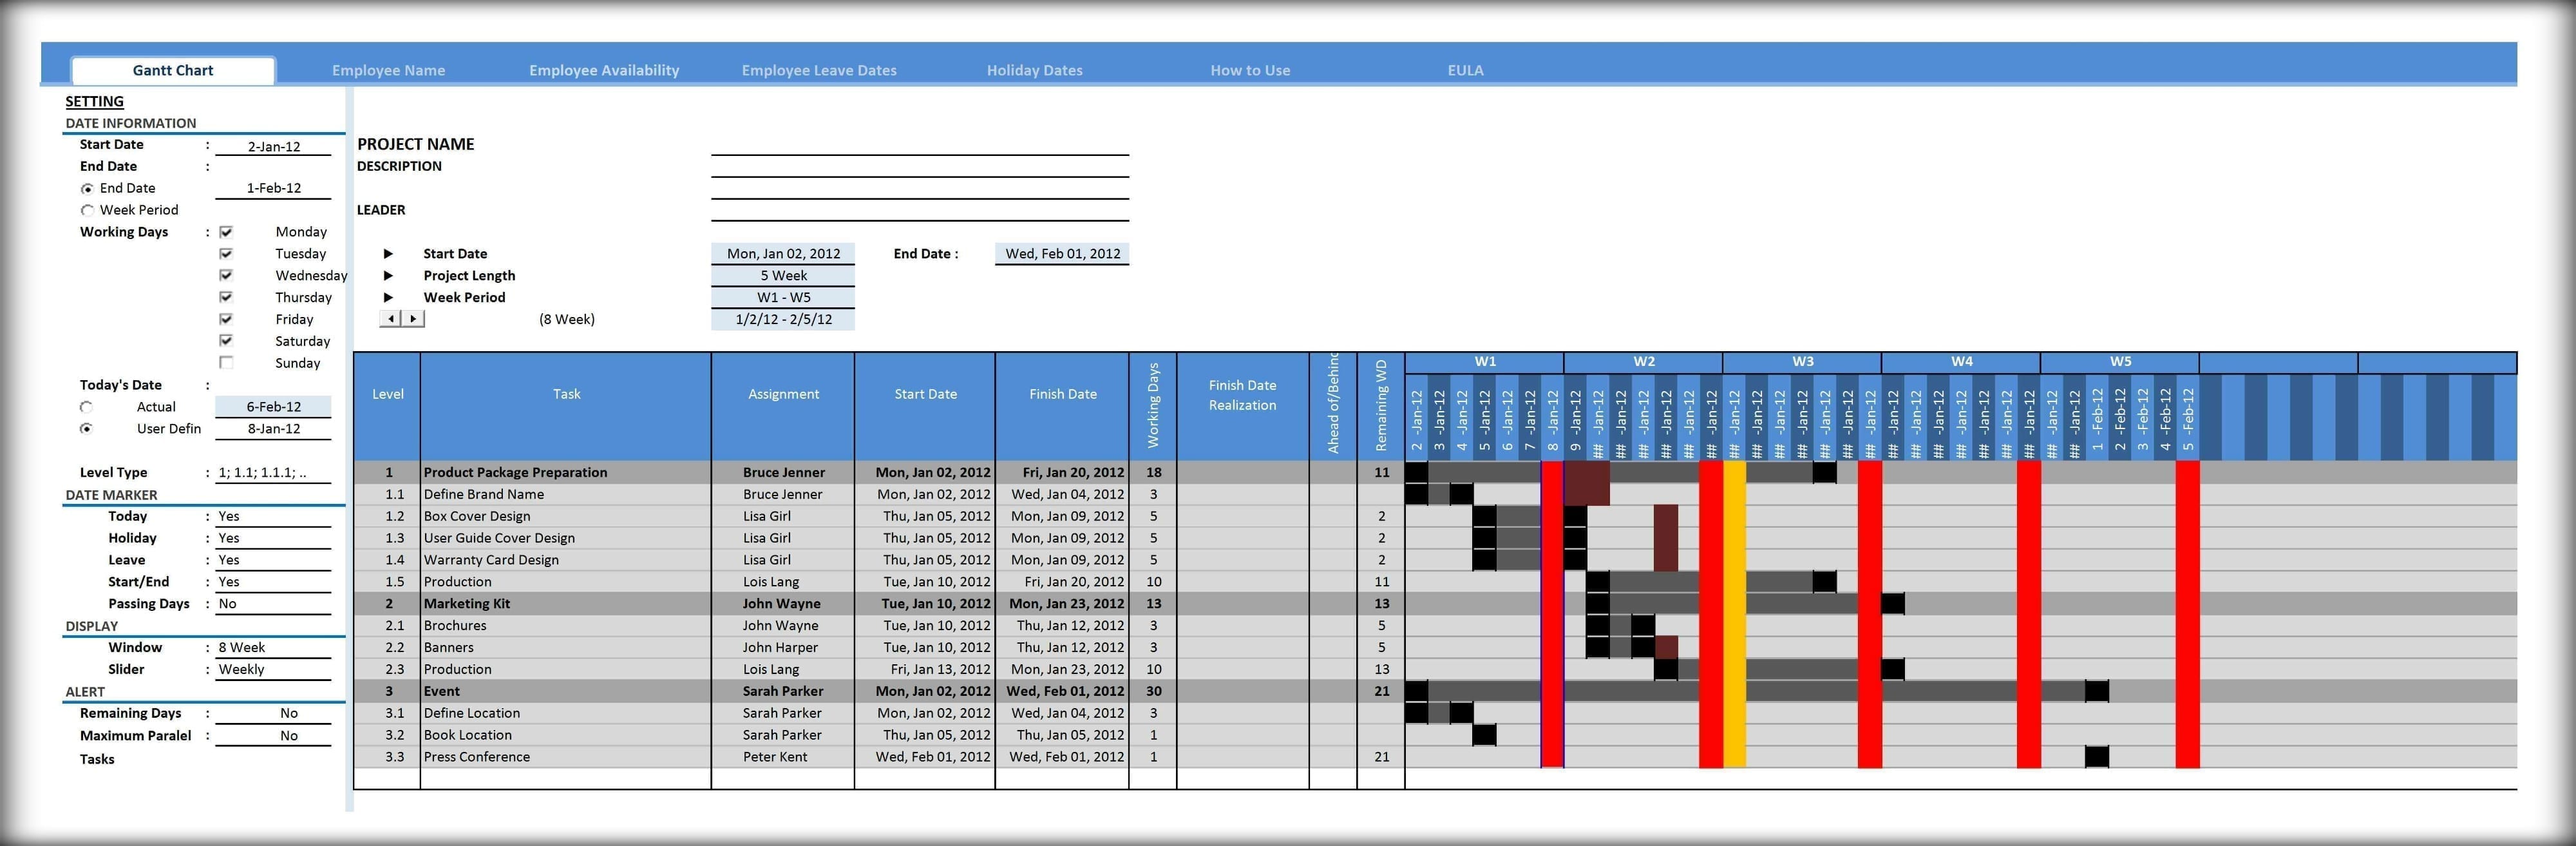 4000×1313 excel spreadsheet gantt chart template spreadsheet templates from excelxo.com
  1248×680 gantt chart template excel spreadshee gantt from db-excel.com
  1280×729 gantt chart template excel spreadshee from db-excel.com
  1162×1519 microsoft excel gantt chart template excel templates excel templates from www.exceltemplate123.us
 Thank you for visiting Downloadable Excel Gantt Chart Template With Color Codes. There are a lot of beautiful templates out there, but it can be easy to feel like a lot of the best cost a ridiculous amount of money, require special design. And if at this time you are looking for information and ideas regarding the Downloadable Excel Gantt Chart Template With Color Codes then, you are in the perfect place. Get this Downloadable Excel Gantt Chart Template With Color Codes for free here. We hope this post Downloadable Excel Gantt Chart Template With Color Codes inspired you and help you what you are looking for.
Downloadable Excel Gantt Chart Template With Color Codes was posted in July 8, 2025 at 2:29 am. If you wanna have it as yours, please click the Pictures and you will go to click right mouse then Save Image As and Click Save and download the Downloadable Excel Gantt Chart Template With Color Codes Picture.. Don’t forget to share this picture with others via Facebook, Twitter, Pinterest or other social medias! we do hope you'll get inspired by SampleTemplates123... Thanks again! If you have any DMCA issues on this post, please contact us!