Excel Gantt Chart With Task Tracking Features
Creating and Using an Excel Gantt Chart with Task Tracking
Gantt charts are powerful project management tools used to visually represent project timelines, tasks, and dependencies. Excel, while not a dedicated project management software, offers the capability to create functional and informative Gantt charts with task tracking features. This allows smaller teams or individuals to effectively manage projects without requiring specialized software.
Building a Basic Gantt Chart in Excel
The foundation of an Excel Gantt chart lies in using conditional formatting to visually represent task durations. Here’s a step-by-step guide:
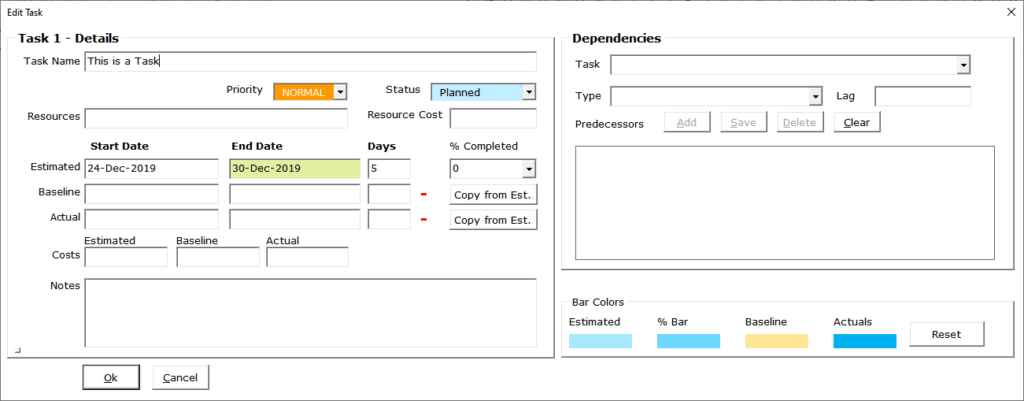
- Data Input: Begin by creating a table with the following columns:
- Task Name: The name of each project task (e.g., “Requirements Gathering,” “Design Phase,” “Development”).
- Start Date: The date the task is scheduled to begin.
- Duration (Days): The number of days estimated for the task.
- End Date: This can be calculated using the formula: `=Start Date + Duration (Days) – 1` (The -1 is to include the start date in the calculation)
- % Complete: A percentage representing the task’s progress (e.g., 0% for not started, 50% for halfway done, 100% for completed). This column is crucial for task tracking.
- Date Range Header: Create a row above your task list representing the project timeline. Enter the project start date in the first cell of this row. In the adjacent cell, enter a formula that adds one day to the previous cell (e.g., if cell B1 contains the project start date, cell C1 would contain `=B1+1`). Drag this formula across the row to create a sequence of dates spanning the project duration. Adjust the column width so each cell represents one day.
- Conditional Formatting: Select the area below the date range header, corresponding to the project tasks and the timeline. Go to “Conditional Formatting” in the “Home” tab and choose “New Rule.” Select “Use a formula to determine which cells to format.” Enter the following formula (adjusting cell references to match your actual data): `=AND(B$2>=$C3,B$2<=$D3)` where:
- `B$2` refers to the first date in your date header row (the `$2` ensures the row stays fixed as you apply the rule).
- `$C3` refers to the Start Date of the first task (the `$C` ensures the column stays fixed).
- `$D3` refers to the End Date of the first task (the `$D` ensures the column stays fixed).
- `B$2>=$C3` checks if the date in the header is greater than or equal to the start date of the current task.
- `B$2<=$D3` checks if the date in the header is less than or equal to the end date of the current task.
Click “Format” and choose a fill color for the task bars. This formula checks if a date falls within the start and end dates of a task, and if it does, it applies the chosen formatting (the fill color).
- Adjusting the Date Range: If your project duration changes, simply extend the date range in the header row by dragging the cell containing the formula `=previous cell + 1` further to the right. The conditional formatting will automatically adjust to accommodate the new dates.
Adding Task Tracking Features
The real power of an Excel Gantt chart lies in its ability to track task progress. Here’s how to integrate task tracking:
- Progress Indication: Utilize the “% Complete” column you created earlier. Modify the conditional formatting rule to visually represent the progress. You can add a second conditional formatting rule that applies a different fill color based on the “% Complete” value. For instance:
- Select the same data range as before.
- Create a new conditional formatting rule using the formula: `=AND(B$2>=$C3,B$2<=($C3+($D3-$C3)*($E3)))` (where `$E3` is the cell containing the "% Complete" value). This formula calculates the date that represents the current progress based on the start date, end date, and percentage complete.
- Apply a different fill color (e.g., a darker shade of the original task bar color) to visually indicate progress.
- Visual Progress Indicators: Another approach is to use data bars. Select the cells under the “% Complete” column. Go to “Conditional Formatting” -> “Data Bars” and choose a style. This will create visual bars within the cells, representing the percentage complete. This provides a quick overview of the overall project progress.
- Status Indicators: Add another column labeled “Status” with a dropdown list containing options like “Not Started,” “In Progress,” “Completed,” “On Hold,” and “Delayed.” You can create this dropdown using the “Data Validation” feature (Data tab -> Data Validation -> Allow: List -> Source: Enter the status options separated by commas). Use conditional formatting to change the cell color based on the selected status. For instance, green for “Completed,” yellow for “In Progress,” and red for “Delayed.” This provides a quick visual cue about the current status of each task.
- Dependencies: While Excel is not ideal for complex dependency management, you can visually represent simple dependencies by adding arrows or connecting lines between tasks. Use the “Insert” tab -> “Shapes” to draw arrows from the end of one task bar to the beginning of another to indicate dependencies. Note: These lines are static and will not automatically adjust if you change task dates.
Benefits of Using Excel for Gantt Charts
- Accessibility: Excel is widely available and familiar to most users.
- Cost-Effective: No need to purchase specialized project management software for simple projects.
- Customization: Excel allows for a high degree of customization to suit specific project needs.
- Easy to Learn: The basic principles of creating a Gantt chart in Excel are relatively simple to grasp.
Limitations
- Limited Automation: Excel lacks the advanced automation features of dedicated project management software (e.g., automatic rescheduling of dependent tasks).
- Scalability: Excel can become cumbersome for managing large and complex projects with many tasks and dependencies.
- Collaboration: Excel’s collaboration features are not as robust as cloud-based project management tools.
Conclusion
Creating an Excel Gantt chart with task tracking is a practical solution for managing smaller projects or for individuals who need a simple, visual way to track progress. While it may not have the advanced features of dedicated software, its accessibility, cost-effectiveness, and customization options make it a valuable tool for basic project management.
 1024×401 create gantt chart excel minutes easy step step guide from www.ganttexcel.com
  0 x 0 create gantt chart excel template teamgantt from www.teamgantt.com
  906×337 gantt chart excel simple steps create excel gantt chart from appfluence.com
  900×480 gantt charts excel templates tutorial video smartsheet from www.smartsheet.com
  1300×489 create gantt chart excel smartsheet from www.smartsheet.com
 Thank you for visiting Excel Gantt Chart With Task Tracking Features. There are a lot of beautiful templates out there, but it can be easy to feel like a lot of the best cost a ridiculous amount of money, require special design. And if at this time you are looking for information and ideas regarding the Excel Gantt Chart With Task Tracking Features then, you are in the perfect place. Get this Excel Gantt Chart With Task Tracking Features for free here. We hope this post Excel Gantt Chart With Task Tracking Features inspired you and help you what you are looking for.
Excel Gantt Chart With Task Tracking Features was posted in September 13, 2025 at 6:55 am. If you wanna have it as yours, please click the Pictures and you will go to click right mouse then Save Image As and Click Save and download the Excel Gantt Chart With Task Tracking Features Picture.. Don’t forget to share this picture with others via Facebook, Twitter, Pinterest or other social medias! we do hope you'll get inspired by SampleTemplates123... Thanks again! If you have any DMCA issues on this post, please contact us!