Dynamic Gantt Chart Template Excel For Scheduling
Dynamic Gantt Chart Template in Excel for Scheduling
Project management thrives on efficient planning and execution. A Gantt chart, a visual representation of a project timeline, is a powerful tool for organizing tasks, setting deadlines, and tracking progress. While specialized project management software offers robust Gantt chart functionality, Microsoft Excel provides a readily accessible and customizable alternative, especially through dynamic Gantt chart templates.
Understanding the Basics of a Gantt Chart
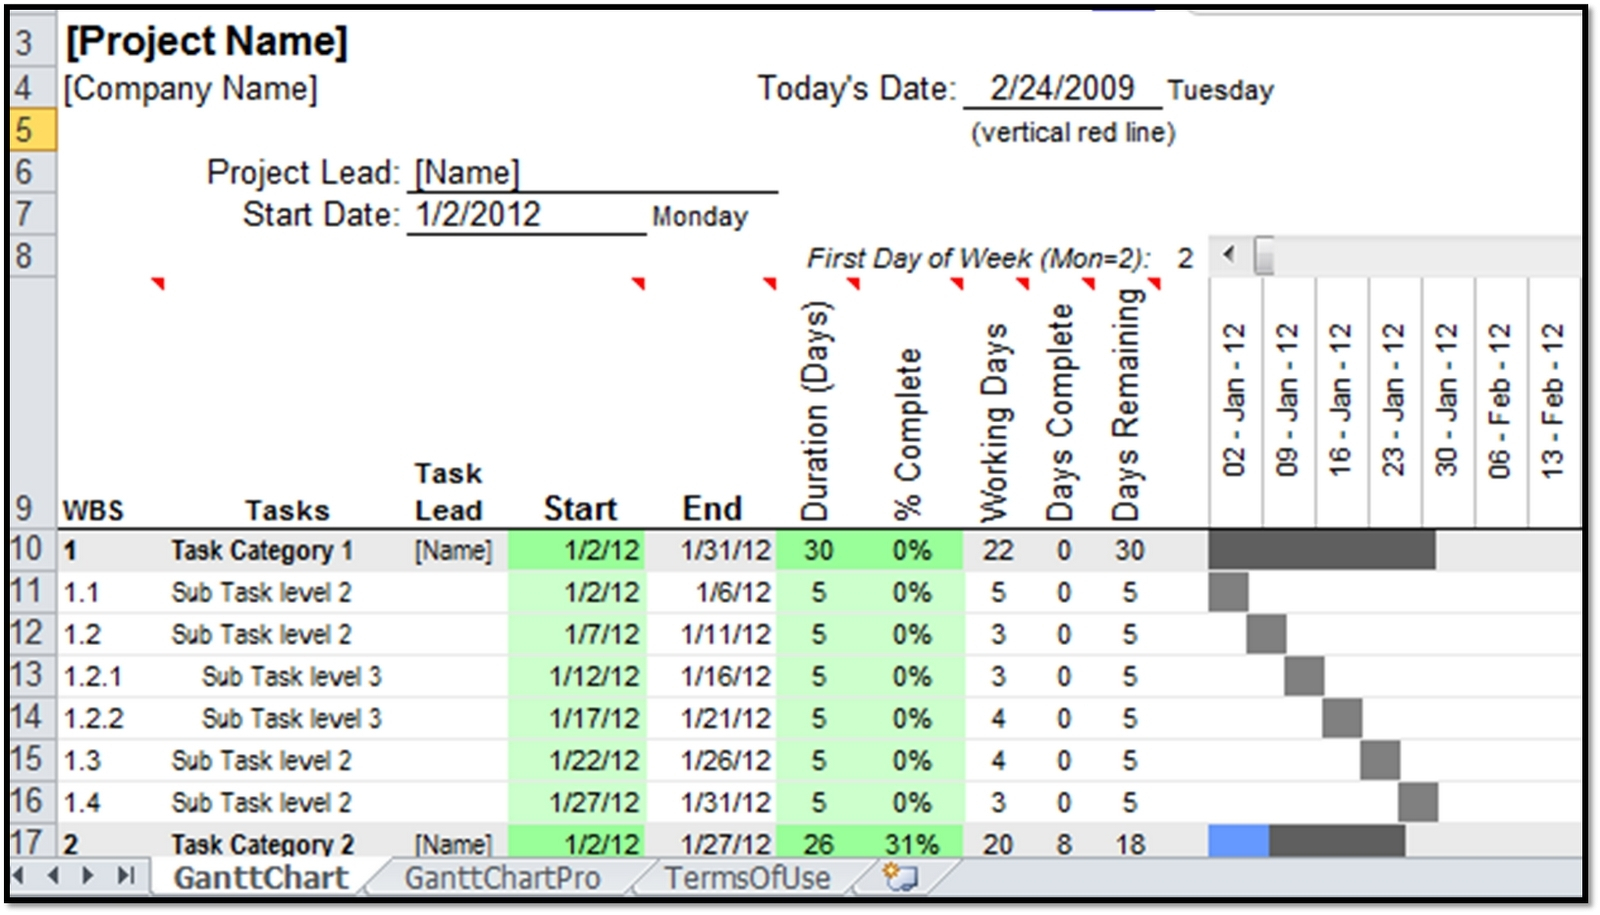
A Gantt chart essentially plots project tasks along a timeline. Each task is represented by a horizontal bar, its length indicating the task’s duration. The chart typically displays:
- Task Name: A clear and concise description of the task.
- Start Date: The date on which the task is scheduled to begin.
- End Date (or Duration): The date the task is scheduled to be completed, or alternatively, the total duration of the task.
- Progress: A visual indicator of the task’s completion percentage.
- Dependencies: Relationships between tasks, showing which tasks must be completed before others can begin.
Why Use a Dynamic Gantt Chart Template in Excel?
Excel’s Gantt chart templates offer several advantages:
- Accessibility: Most users are familiar with Excel, eliminating the learning curve associated with specialized project management software.
- Cost-Effectiveness: Excel is often already installed, avoiding the need for additional software purchases.
- Customization: Templates can be tailored to specific project requirements, including adding columns, adjusting formatting, and incorporating custom calculations.
- Ease of Use: Simple data entry allows for quick updates and adjustments to the schedule.
- Collaboration: Excel files can be easily shared and collaborated on by multiple team members.
Key Features of a Dynamic Gantt Chart Template
A well-designed dynamic Gantt chart template in Excel should incorporate the following features:
- Automated Chart Generation: The chart should automatically update based on changes to task data (start dates, durations, progress). This is typically achieved using formulas and conditional formatting.
- Dynamic Timeline: The timeline should automatically adjust based on the project’s start and end dates. Consider using formulas to calculate the number of days, weeks, or months displayed.
- Progress Tracking: A visual progress bar or indicator should reflect the percentage of completion for each task. Conditional formatting can be used to color-code the bars based on progress.
- Dependency Visualization (Optional): If dependencies are critical to the project, consider incorporating a mechanism to visually represent them. This might involve drawing arrows or lines between task bars.
- Highlighting: Use conditional formatting to highlight important milestones, overdue tasks, or tasks due to start soon.
- Clear Visual Presentation: The chart should be easy to read and understand, with clear labels and appropriate color choices.
- Date Input Validation: Implement data validation rules to ensure that start and end dates are entered in the correct format.
- Error Handling: Include formulas to handle potential errors, such as invalid date entries or incorrect duration calculations.
Creating a Dynamic Gantt Chart Template in Excel: A Step-by-Step Guide
Here’s a simplified approach to creating a dynamic Gantt chart template:
- Set up the Data Table:
- Create columns for: “Task Name,” “Start Date,” “Duration (Days),” “End Date,” “Progress (%)”
- Enter the project’s start date in a separate cell (e.g., A1).
- Calculate the End Date:
- In the “End Date” column, use the formula: `=Start Date + Duration (Days)`.
- Create the Chart Data:
- Create a new table to hold the data for the Gantt chart. This table will be used to generate the visual representation.
- Include columns for: “Task Name,” “Start Offset” (days from the project start date), “Duration (Days)”
- Calculate the Start Offset:
- In the “Start Offset” column, use the formula: `=Start Date – $A$1` (where $A$1 is the cell containing the project start date). This calculates the number of days between the project start date and the task’s start date.
- Insert a Stacked Bar Chart:
- Select the “Task Name” and “Start Offset” columns.
- Insert a stacked bar chart (Insert > Charts > Bar > Stacked Bar).
- Format the Chart:
- Remove the Fill from the “Start Offset” Series: This makes the “Start Offset” bars invisible, effectively positioning the task bars at the correct starting points.
- Add the “Duration (Days)” Series: Right-click on the chart, select “Select Data,” click “Add,” and select the “Duration (Days)” column as the series values. The series name can be left blank.
- Format the Task Bars: Choose appropriate colors and remove the outline.
- Adjust the Horizontal Axis: Format the horizontal axis to display dates instead of numbers. Set the minimum value of the axis to the numerical representation of the project start date (e.g., using the `VALUE()` function: `=VALUE(“1/1/2024”)`). The maximum value can be calculated based on the project’s end date.
- Reverse the Task Order: Format the vertical axis and select “Categories in reverse order” to display tasks in the correct order.
- Add Progress Bars (Optional):
- Add a column to the chart data table for “Progress Duration” calculated as: `=Duration (Days) * Progress (%)`.
- Add this column as another series to the stacked bar chart, positioning it after the “Duration (Days)” series.
- Format the “Progress Duration” bars with a different color to visually represent progress.
- Implement Conditional Formatting:
- Use conditional formatting to highlight tasks based on their status (e.g., overdue, completed, due to start soon). This can be done by creating rules that change the color of the task bars or cells in the data table based on date comparisons and progress values.
Tips for Enhancing Your Dynamic Gantt Chart
- Use Named Ranges: Define named ranges for data tables to improve readability and maintainability of formulas.
- Implement Drop-Down Lists: Use data validation to create drop-down lists for task status, priority, or other relevant categories.
- Automate Reporting: Create pivot tables and charts to summarize project progress and identify potential issues.
- Incorporate Milestones: Mark significant milestones on the Gantt chart to highlight key achievements.
- Consider Visual Basic for Applications (VBA): For more complex requirements, VBA can be used to automate tasks and create custom features.
Conclusion
A dynamic Gantt chart template in Excel provides a practical and accessible solution for project scheduling and tracking. By leveraging Excel’s features and incorporating the principles outlined above, you can create a powerful visual tool to effectively manage your projects and improve collaboration within your team. While it might not offer the advanced features of dedicated project management software, it’s a valuable alternative for smaller projects or for teams already comfortable using Excel.
 1600×915 gantt chart excel template xls calendar template excel gantt from db-excel.com
 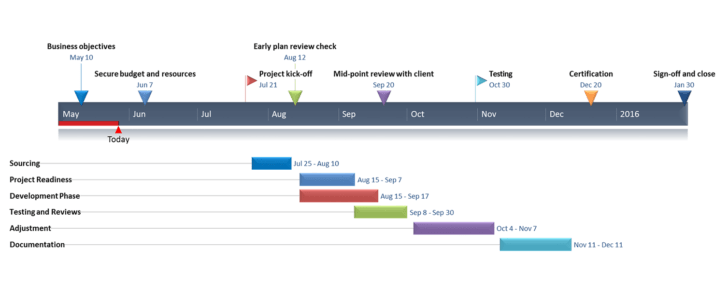 728×295 excel gantt chart spreadsheet template db excelcom from db-excel.com
 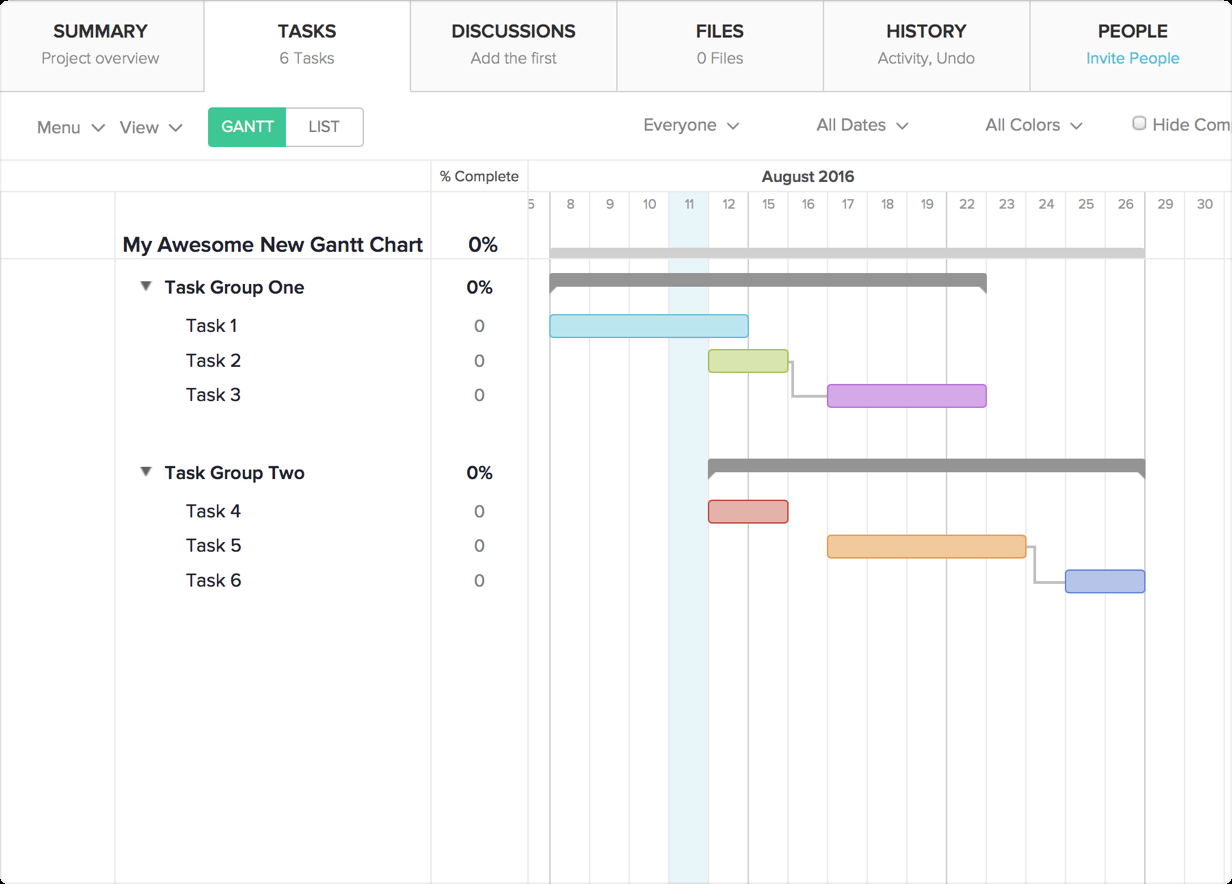 1232×884 gantt chart excel template teamgantt gantt from db-excel.com
  1080×680 excel progress gantt chart gantt chart excel template from gantt-chart-excel.com
  0 x 0 gantt chart excel template teamgantt from www.teamgantt.com
  1190×613 github halajohnexcel gantt chart excel gantt chart template from github.com
  1022×556 excel gantt chart prioritization blog from appfluence.com
  1038×545 gantt chart excel template project management templates from www.techno-pm.com
  911×478 excel gantt chart template engineering management from www.engineeringmanagement.info
  1501×1173 gantt chart template excel excel templates from www.exceltemplate123.us
  1524×874 create gantt chart excel template instructions from plan.io
  814×460 office timeline gantt chart excel step step visual tutorial from www.officetimeline.com
 Thank you for visiting Dynamic Gantt Chart Template Excel For Scheduling. There are a lot of beautiful templates out there, but it can be easy to feel like a lot of the best cost a ridiculous amount of money, require special design. And if at this time you are looking for information and ideas regarding the Dynamic Gantt Chart Template Excel For Scheduling then, you are in the perfect place. Get this Dynamic Gantt Chart Template Excel For Scheduling for free here. We hope this post Dynamic Gantt Chart Template Excel For Scheduling inspired you and help you what you are looking for.
Dynamic Gantt Chart Template Excel For Scheduling was posted in November 15, 2025 at 9:06 am. If you wanna have it as yours, please click the Pictures and you will go to click right mouse then Save Image As and Click Save and download the Dynamic Gantt Chart Template Excel For Scheduling Picture.. Don’t forget to share this picture with others via Facebook, Twitter, Pinterest or other social medias! we do hope you'll get inspired by SampleTemplates123... Thanks again! If you have any DMCA issues on this post, please contact us!