Interactive Google Sheets Gantt Chart Template
Interactive Google Sheets Gantt Chart Template: Project Management Made Easy
Project management can often feel like navigating a complex maze. Juggling tasks, deadlines, and team members requires meticulous planning and constant monitoring. A Gantt chart is a powerful visual tool that simplifies this process, allowing you to map out project timelines, track progress, and identify potential bottlenecks. While dedicated project management software offers robust features, a Google Sheets Gantt chart template provides a readily accessible, collaborative, and cost-effective solution for many teams.
Why Use a Google Sheets Gantt Chart Template?
Google Sheets, as part of Google Workspace, is a cloud-based spreadsheet application known for its accessibility, collaboration features, and user-friendly interface. Leveraging Google Sheets for a Gantt chart offers several advantages:
- Accessibility: Accessible from anywhere with an internet connection, allowing for real-time updates and collaboration.
- Collaboration: Multiple team members can simultaneously view and edit the chart, fostering seamless communication and coordination.
- Cost-Effective: Google Sheets is often included in Google Workspace subscriptions, making it a budget-friendly option compared to specialized project management software.
- Customization: Templates can be easily customized to fit specific project requirements, adding or removing columns, adjusting timelines, and tailoring visual elements.
- Ease of Use: Google Sheets is familiar to most users, minimizing the learning curve and enabling quick adoption.
Key Features of an Interactive Gantt Chart Template
An effective interactive Google Sheets Gantt chart template goes beyond a static visual representation. It incorporates dynamic elements that allow for real-time adjustments and provide valuable insights into project progress. Here are some key features to look for:
- Task List: A comprehensive list of all project tasks, including descriptions, start dates, end dates, and assigned team members.
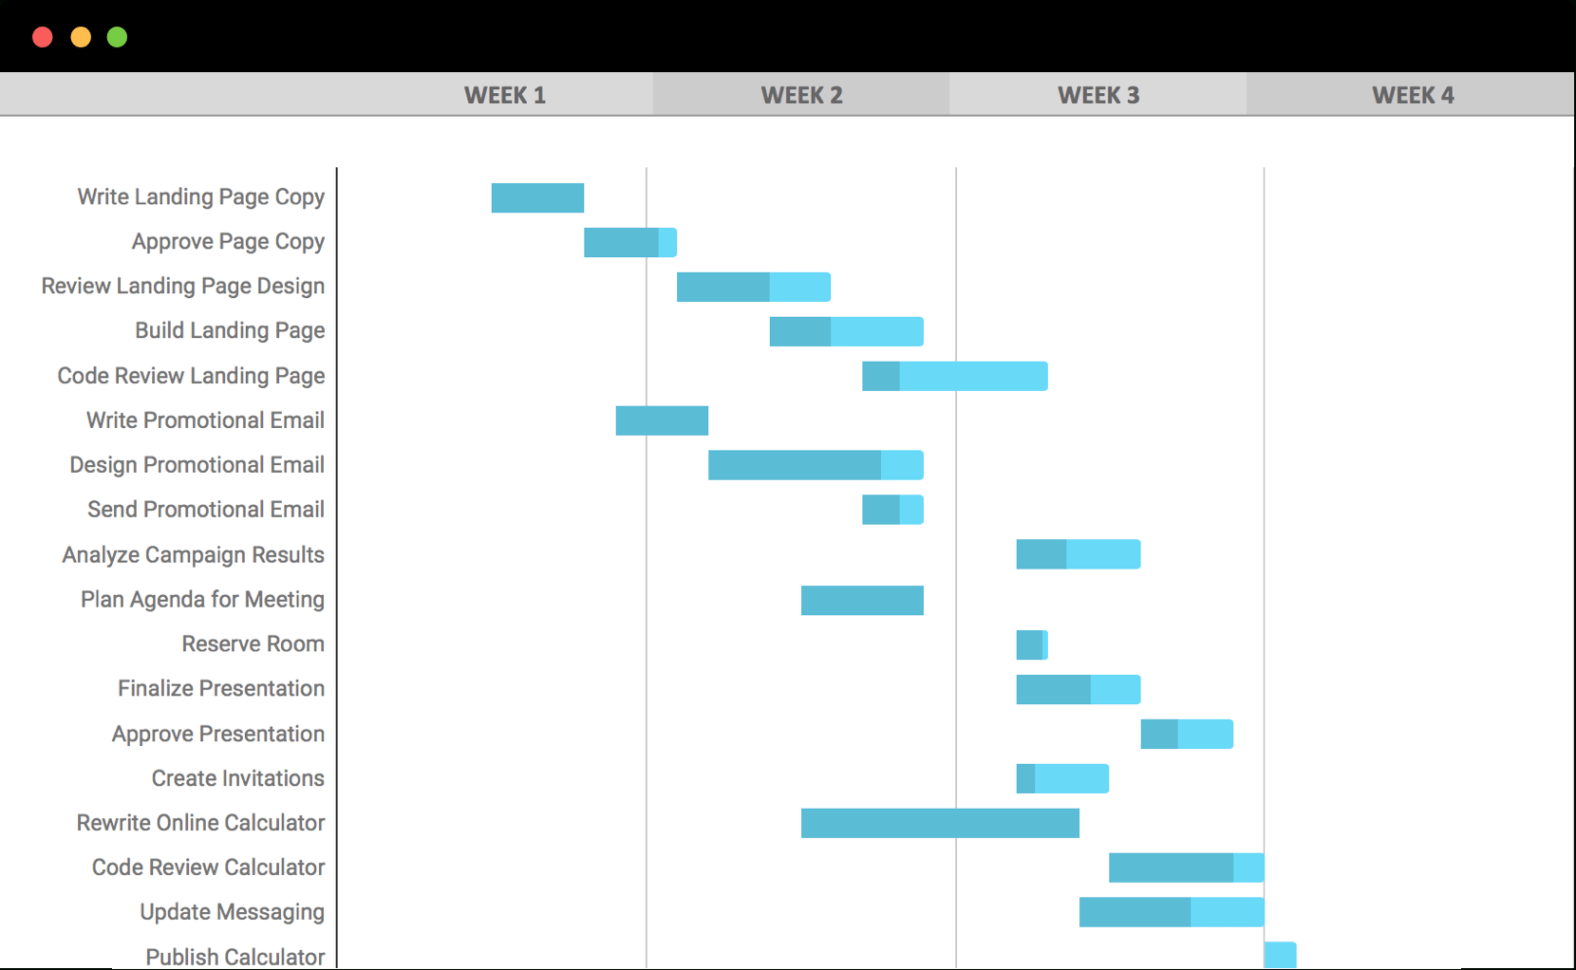
- Timeline Visualization: A visual representation of the project timeline, with bars representing the duration of each task. This allows you to see the overall project schedule at a glance.
- Dependencies: The ability to define dependencies between tasks, ensuring that tasks are completed in the correct order. This helps to avoid delays and maintain project momentum.
- Progress Tracking: A mechanism for tracking the progress of each task, typically using a percentage complete indicator. This provides a clear picture of project status.
- Resource Allocation: The ability to assign resources (e.g., team members, equipment) to tasks, ensuring that resources are used efficiently.
- Conditional Formatting: Visual cues, such as color-coding, to highlight critical tasks, overdue deadlines, or tasks requiring immediate attention.
- Calculated Dates: Formulas that automatically calculate start and end dates based on dependencies and task durations, reducing manual effort and ensuring accuracy.
- Interactive Filters: Filters that allow you to quickly view tasks based on criteria such as assigned team member, status, or priority.
- Dropdown Menus: Dropdown menus for selecting task status, priority, and assigned team members, streamlining data entry and ensuring consistency.
Creating Your Own Interactive Gantt Chart Template
You can find readily available Gantt chart templates for Google Sheets online, or you can create your own. Here’s a step-by-step guide to creating a basic interactive template:
- Set up the Spreadsheet: Open a new Google Sheet. In the first few columns, create headers for: Task Name, Start Date, End Date, Duration (in days), % Complete, Assigned To, and Dependencies (if any).
- Enter Task Information: Populate the task list with your project’s tasks, including start dates and end dates.
- Calculate Duration: In the Duration column, use the formula `=(End Date – Start Date)+1` to calculate the duration of each task in days. The +1 ensures that the start date is included in the duration.
- Create the Timeline: In the columns to the right of your task list, create headers for each day of your project’s timeline. This will form the basis of your Gantt chart visualization.
- Conditional Formatting for Gantt Bars: This is where the magic happens. Select the range of cells under the timeline headers, starting from the first task. Go to Format > Conditional formatting.
- Format rules: Choose “Custom formula is”.
- Enter the formula: This is the key part. The formula needs to check if the current date (the column header) falls between the task’s start and end dates. Assuming your task list starts in column A and your first date is in cell H1, a simplified formula would be: `=AND(H$1>=$B2, H$1<=$C2)` (adjust the column letters if necessary). Explanation: `H$1` refers to the date in the header row (the `$` makes the row absolute, so it doesn’t change as you copy the formatting). `$B2` and `$C2` refer to the Start Date and End Date of the task (the `$` makes the column absolute). The `AND` function ensures that both conditions are met.
- Formatting style: Choose a fill color to represent the Gantt bar.
- Apply to range: Make sure the correct range is selected (the entire timeline area).
- Add Progress Tracking: In the “% Complete” column, use data validation (Data > Data validation) to create a list of percentages (e.g., 0%, 25%, 50%, 75%, 100%). This allows users to easily select the progress of each task. You can enhance this further with conditional formatting to visually represent progress with different colors or fill patterns.
- Implement Dependencies: If tasks have dependencies, use formulas in the Start Date column to automatically adjust the start date based on the completion of the preceding task. For example, if Task B depends on Task A, the Start Date of Task B could be `=C2+1` (where C2 is the End Date of Task A).
- Assign Resources with Dropdown Menus: Create a separate sheet listing team member names. Then, in the “Assigned To” column, use data validation (Data > Data validation) to create a list from the range of names on the separate sheet. This allows you to assign tasks to team members using a dropdown menu.
- Add Filters: Use the “Create a filter” option (Data > Create a filter) to add filters to the column headers. This allows you to quickly filter the task list based on criteria such as Assigned To, Status, or Priority.
Tips for Effective Gantt Chart Management
- Regularly Update the Chart: Keep the Gantt chart updated with the latest information to ensure that it accurately reflects project progress.
- Communicate Clearly: Use the Gantt chart as a communication tool to keep team members informed of project status and deadlines.
- Adjust as Needed: Be prepared to adjust the Gantt chart as project requirements change. Unexpected delays or scope changes may necessitate modifications to the timeline.
- Involve the Team: Encourage team members to actively participate in the creation and maintenance of the Gantt chart to foster a sense of ownership and collaboration.
- Leverage Add-ons: Explore Google Sheets add-ons that can enhance the functionality of your Gantt chart, such as automated notifications or advanced reporting features.
By implementing an interactive Google Sheets Gantt chart template, you can streamline project management, improve team collaboration, and increase the likelihood of project success. Its accessibility, customization options, and ease of use make it a valuable tool for teams of all sizes.
 1576×970 google sheets gantt chart template teamgantt gantt from db-excel.com
  1170×658 gantt chart excel template google sheets compatible from spitmarket.com
  1202×601 gantt chart google sheets template deeps from www.deepsonline.com
  1358×843 gantt chart google sheets edrawmax from www.edrawmax.com
  1786×1040 google sheet gantt chart template from instagantt.com
 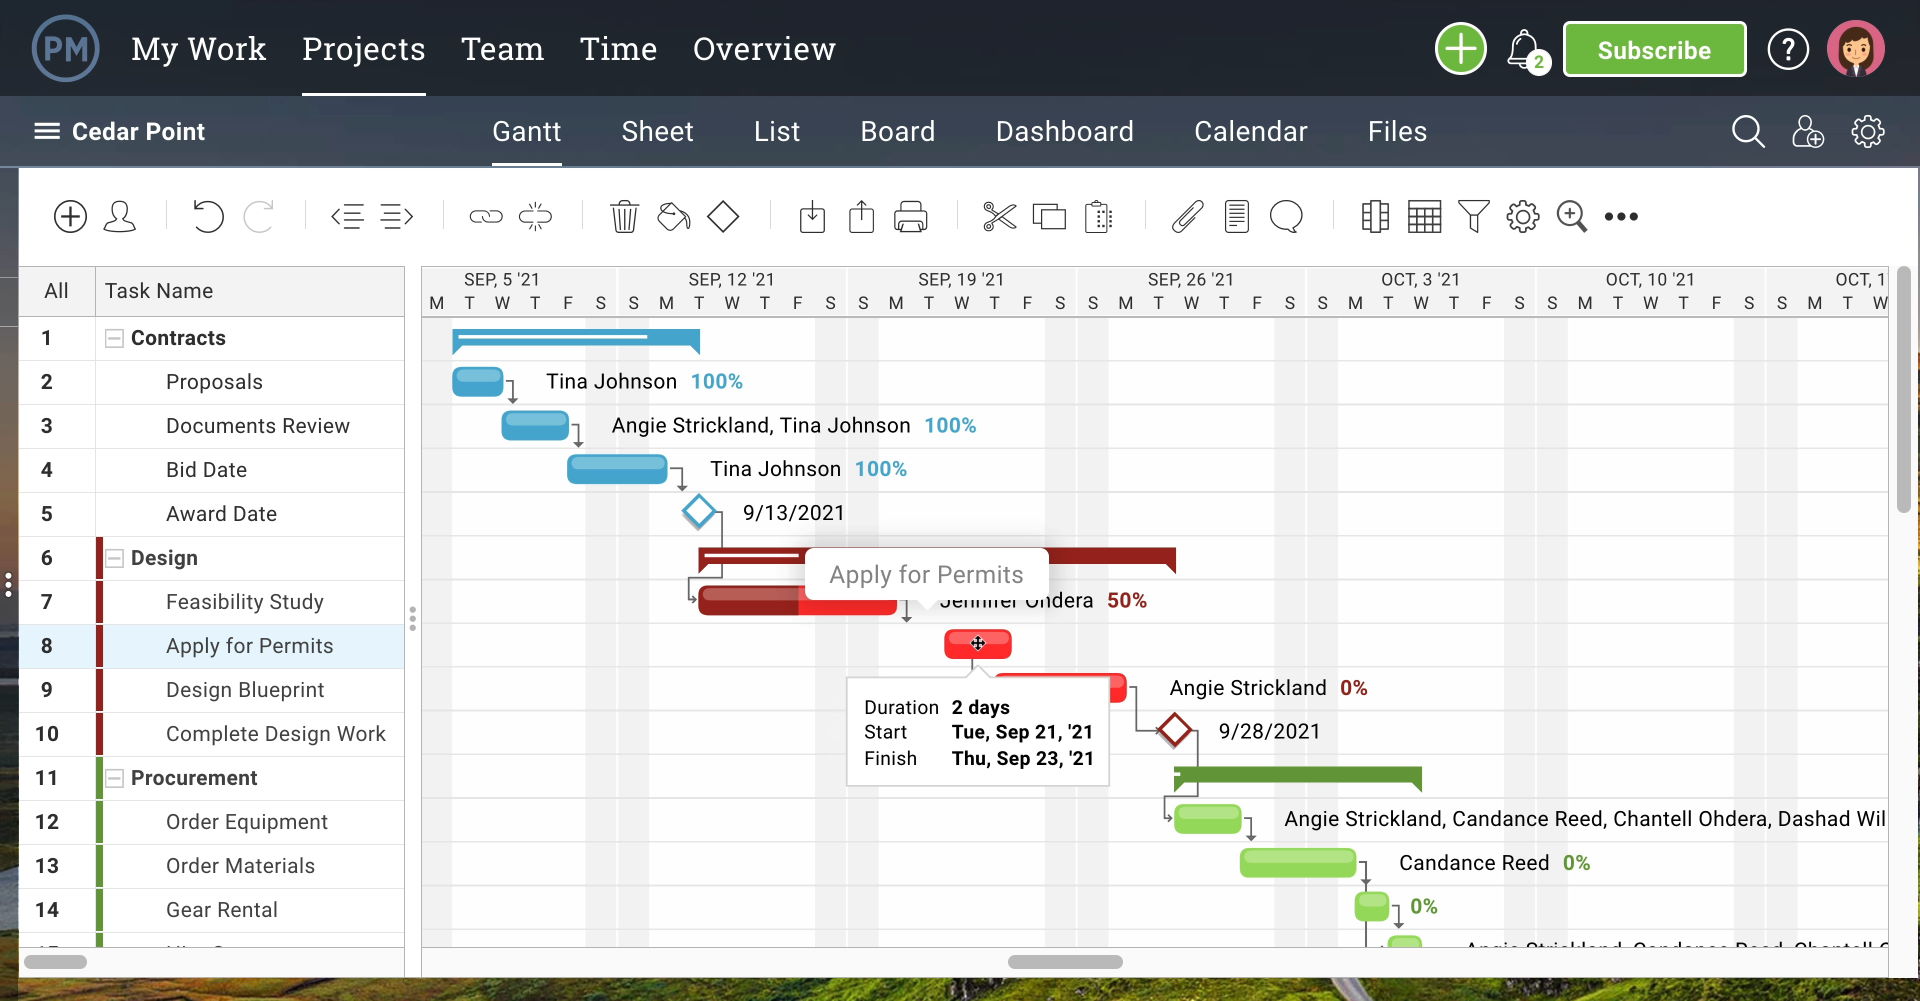 1920×1001 easy ways create gantt chart google sheets templates from www.projectmanager.com
  1300×781 gantt chart google sheets smartsheet from www.smartsheet.com
 Thank you for visiting Interactive Google Sheets Gantt Chart Template. There are a lot of beautiful templates out there, but it can be easy to feel like a lot of the best cost a ridiculous amount of money, require special design. And if at this time you are looking for information and ideas regarding the Interactive Google Sheets Gantt Chart Template then, you are in the perfect place. Get this Interactive Google Sheets Gantt Chart Template for free here. We hope this post Interactive Google Sheets Gantt Chart Template inspired you and help you what you are looking for.
Interactive Google Sheets Gantt Chart Template was posted in August 29, 2025 at 7:25 pm. If you wanna have it as yours, please click the Pictures and you will go to click right mouse then Save Image As and Click Save and download the Interactive Google Sheets Gantt Chart Template Picture.. Don’t forget to share this picture with others via Facebook, Twitter, Pinterest or other social medias! we do hope you'll get inspired by SampleTemplates123... Thanks again! If you have any DMCA issues on this post, please contact us!