Gantt Chart Template For Budget Tracking
Gantt Chart Template for Budget Tracking: A Comprehensive Guide
Effectively managing a project’s budget is crucial for its success. A budget overrun can lead to delays, scope creep, and even project failure. While spreadsheets are often used, a Gantt chart template offers a visual and dynamic alternative for tracking expenses against planned timelines.
What is a Gantt Chart and Why Use it for Budget Tracking?
A Gantt chart is a horizontal bar chart that visually represents a project schedule. Each bar represents a task or activity, and its length corresponds to the task’s duration. The chart also displays dependencies between tasks, milestones, and the overall project timeline. Traditionally, Gantt charts focus on task scheduling, but adapting them for budget tracking provides significant benefits:
- Visual Representation of Spending: Instead of sifting through rows of numbers, a Gantt chart shows budget allocation and expenditure against the project timeline in a clear, graphical format.
- Improved Budget Control: Easily identify discrepancies between planned and actual spending for each task. This allows for early intervention and corrective measures.
- Enhanced Communication: Gantt charts facilitate clear communication about the budget status with stakeholders, providing a shared understanding of financial progress.
- Better Forecasting: By tracking historical spending data within the Gantt chart, project managers can improve future budget estimates and resource allocation.
- Proactive Problem Solving: Identifying potential budget overruns early on allows for proactive adjustments to the project plan, minimizing negative impact.
Creating a Gantt Chart Template for Budget Tracking
Several software options are available for creating Gantt charts, including Microsoft Project, Smartsheet, Asana, and online Gantt chart tools. The specific steps may vary depending on the software, but the general process remains the same:
- Define Project Tasks and Activities: Break down the project into smaller, manageable tasks. These will form the rows of your Gantt chart. Be specific in your task descriptions to ensure accurate budget allocation.
- Estimate Task Durations: Determine how long each task is expected to take. This will determine the length of the bars in the chart.
- Establish Task Dependencies: Identify any dependencies between tasks. This means one task cannot start until another is completed. These dependencies are represented by arrows connecting the bars.
- Allocate Budget to Each Task: Assign a specific budget amount to each task. This is a crucial step for budget tracking. You’ll need to gather cost information related to labor, materials, equipment, and any other expenses associated with the task.
- Set Baseline Budget: Once all tasks have been allocated a budget, create a baseline. This serves as the original budget plan against which actual spending will be compared.
- Input Actual Costs: As the project progresses, regularly update the Gantt chart with actual costs incurred for each task. This is where the budget tracking comes to life.
- Track Variances: Calculate the variance between the baseline budget and the actual costs for each task. This will highlight any budget overruns or underruns.
- Visualize Budget Data: Use conditional formatting or other visual cues to highlight tasks that are exceeding their budget or falling behind schedule. This allows for quick identification of problem areas.
- Regularly Update the Chart: Gantt charts are not static documents. They need to be regularly updated with progress and cost information to maintain their accuracy and usefulness.
Essential Elements of a Budget-Focused Gantt Chart
Beyond the standard elements of a Gantt chart, incorporating these features will enhance its effectiveness for budget tracking:
- Budget Column: A dedicated column displaying the allocated budget for each task.
- Actual Cost Column: A column for entering the actual costs incurred for each task.
- Variance Column: A calculated column showing the difference between the budget and actual cost (Budget – Actual Cost). A positive variance indicates an underrun, while a negative variance indicates an overrun.
- Percentage of Budget Spent Column: A calculated column showing the percentage of the budget that has been spent on each task (Actual Cost / Budget * 100%).
- Status Indicators: Use color-coded indicators (e.g., green, yellow, red) to visually represent the budget status of each task (e.g., within budget, nearing budget limit, over budget).
- Resource Allocation: If possible, integrate resource allocation into the Gantt chart to track labor costs associated with each task.
- Cost Breakdown Structure (CBS): Linking the Gantt chart to a Cost Breakdown Structure can provide a more detailed view of project expenses. The CBS organizes costs by category (e.g., labor, materials, travel), making it easier to identify areas where spending is exceeding expectations.
- Earned Value Management (EVM) Metrics: For more sophisticated budget tracking, consider incorporating EVM metrics such as Planned Value (PV), Earned Value (EV), and Actual Cost (AC). These metrics provide a comprehensive assessment of project performance and budget efficiency.
Tips for Effective Budget Tracking with Gantt Charts
- Accurate Budget Allocation: Invest time in accurately estimating the budget for each task. This is the foundation of effective budget tracking.
- Regular Updates: Update the Gantt chart regularly with actual costs. The more frequently you update the chart, the more quickly you can identify and address potential budget problems.
- Early Intervention: Don’t wait until a task is significantly over budget to take action. Address potential problems early on to minimize their impact.
- Communication: Communicate regularly with stakeholders about the budget status of the project. This helps to ensure that everyone is aware of any potential problems and can work together to find solutions.
- Flexibility: Be prepared to adjust the budget and project plan as needed. Unexpected events can occur that impact costs. A flexible approach will help you to adapt to these changes.
- Choose the Right Software: Select a Gantt chart software that meets your specific needs and budget. Consider factors such as ease of use, features, and integration with other tools.
- Training: Ensure that all team members who will be using the Gantt chart are properly trained on how to use it effectively.
Conclusion
Using a Gantt chart template for budget tracking provides a powerful and visual way to manage project finances. By incorporating budget-specific elements and following best practices, you can gain greater control over project costs, improve communication with stakeholders, and increase the likelihood of project success. Regular monitoring, proactive problem-solving, and a commitment to accurate data entry are key to realizing the full benefits of this approach.
 2560×1978 gantt chart budget staffing plan exceltemplatenet from exceltemplate.net
 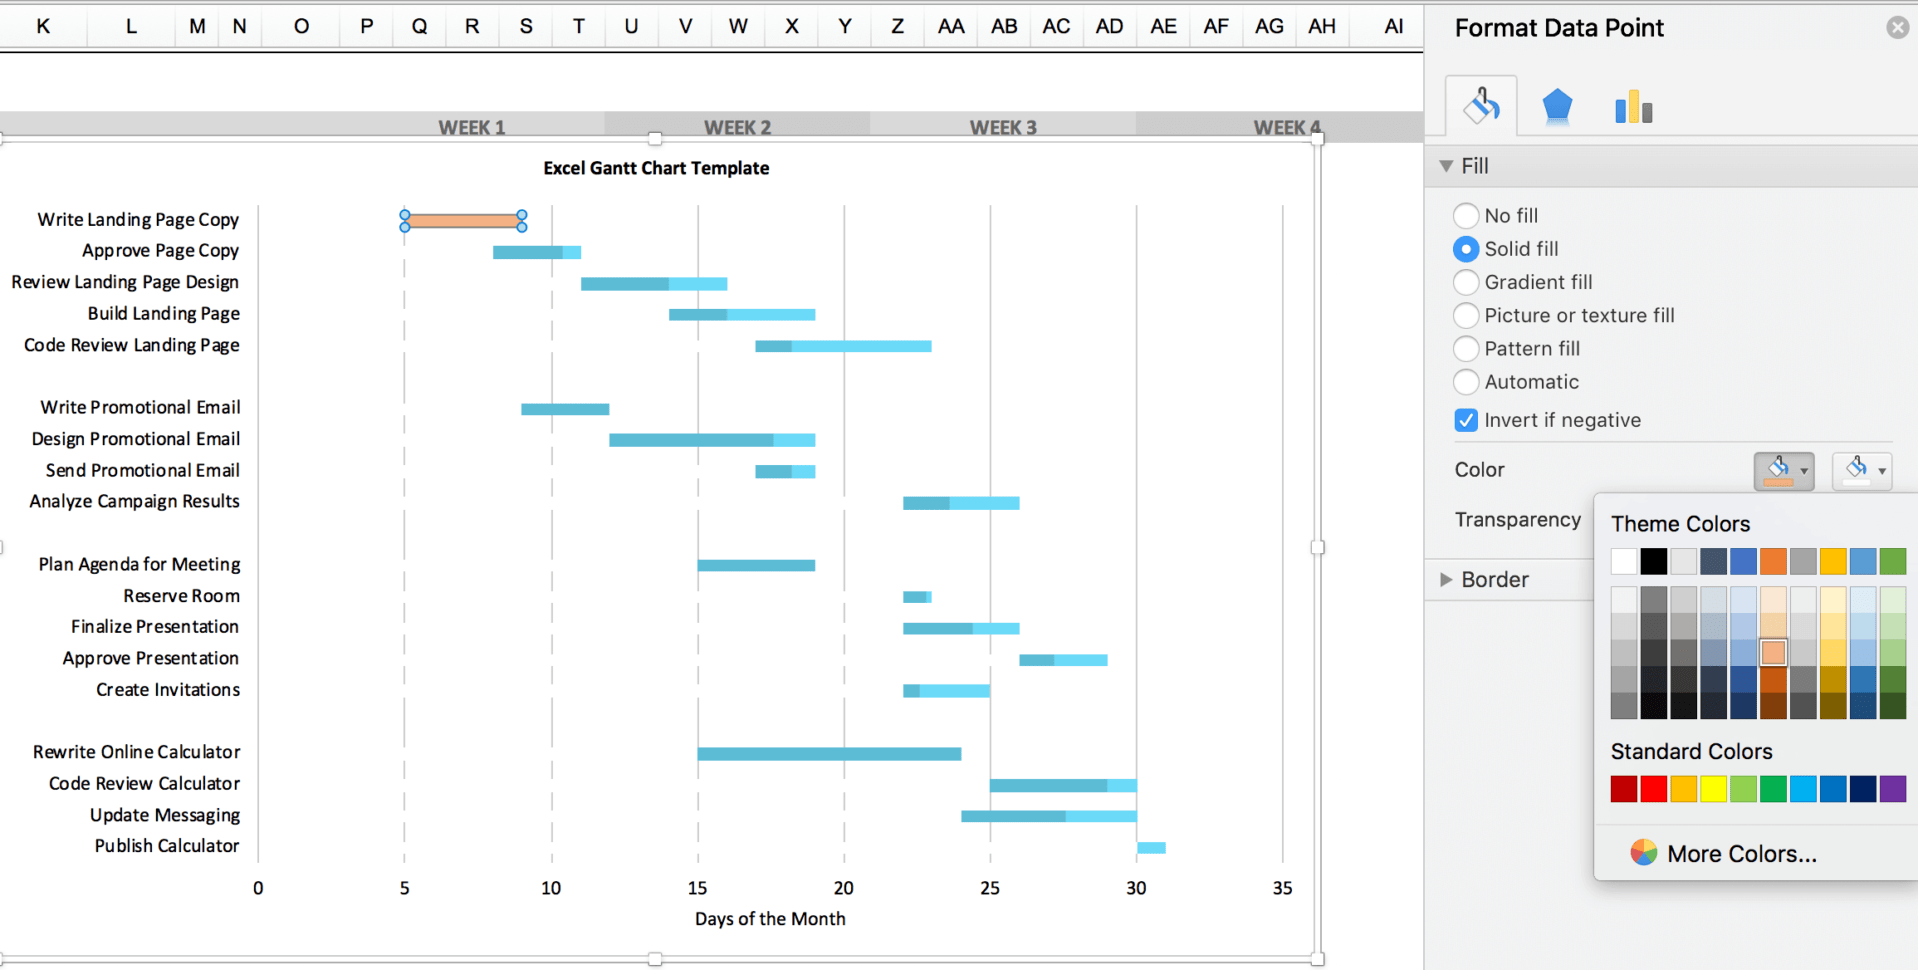 1918×970 gantt chart budget template spreadshee gantt chart budget from db-excel.com
 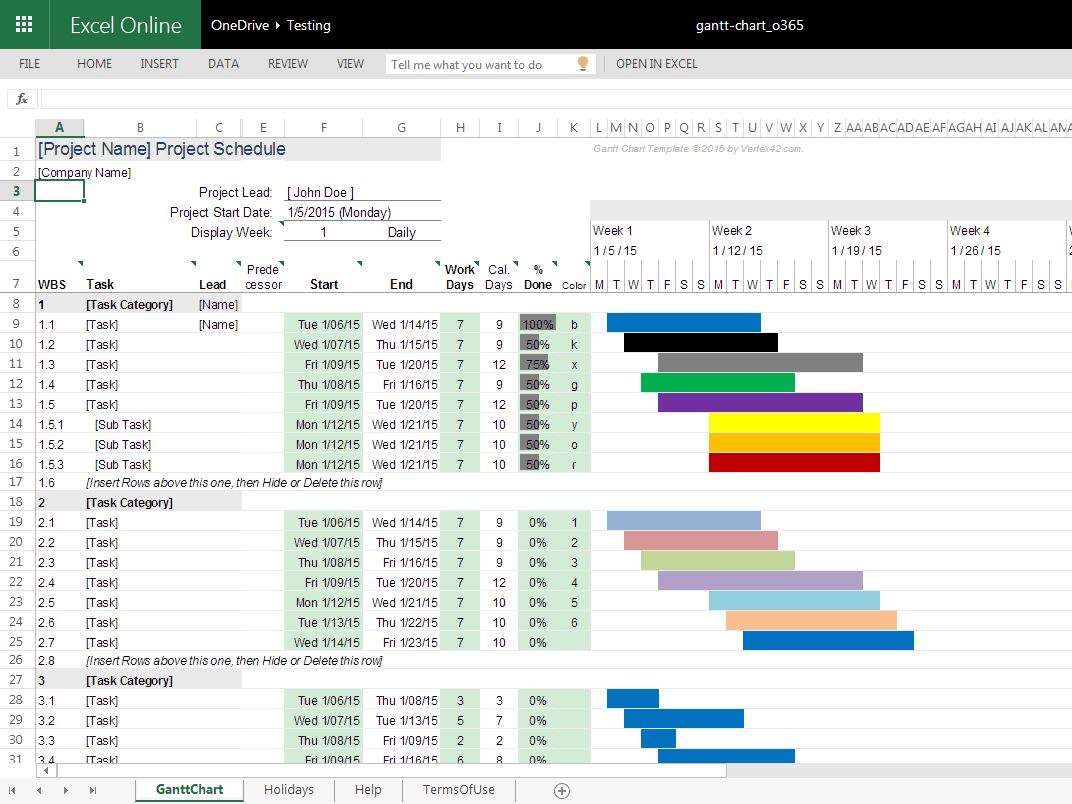 1072×804 gantt chart budget template db excelcom from db-excel.com
  1048×493 project budget template gantt chart excel template from www.ganttexcel.com
  900×695 gantt chart template project budget edit fill sign handypdf from handypdf.com
 Thank you for visiting Gantt Chart Template For Budget Tracking. There are a lot of beautiful templates out there, but it can be easy to feel like a lot of the best cost a ridiculous amount of money, require special design. And if at this time you are looking for information and ideas regarding the Gantt Chart Template For Budget Tracking then, you are in the perfect place. Get this Gantt Chart Template For Budget Tracking for free here. We hope this post Gantt Chart Template For Budget Tracking inspired you and help you what you are looking for.
Gantt Chart Template For Budget Tracking was posted in July 14, 2025 at 8:44 pm. If you wanna have it as yours, please click the Pictures and you will go to click right mouse then Save Image As and Click Save and download the Gantt Chart Template For Budget Tracking Picture.. Don’t forget to share this picture with others via Facebook, Twitter, Pinterest or other social medias! we do hope you'll get inspired by SampleTemplates123... Thanks again! If you have any DMCA issues on this post, please contact us!
Related For Gantt Chart Template For Budget Tracking
Printable Gantt Chart Template Mont
Printable Monthly Gantt Chart Templates: Your Guide to ProjectGoogle Sheets Gantt Chart Template
Google Sheets Gantt Chart for Event Planning Google SheetsPrintable Gantt Chart Template For
Printable Gantt Chart Template for Research Printable Gantt Chart