Gantt Chart With Critical Path Visualization Template
Gantt Chart with Critical Path Visualization
A Gantt chart is a powerful project management tool that visually represents a project schedule. It displays tasks, their durations, start and end dates, and dependencies, all within a timeline. When combined with critical path visualization, a Gantt chart becomes an indispensable asset for planning, executing, and monitoring projects effectively.
Understanding the Gantt Chart
At its core, a Gantt chart is a bar chart that illustrates a project’s schedule. The horizontal axis represents time, while the vertical axis lists the tasks involved in the project. Each task is represented by a horizontal bar, the length of which corresponds to the task’s duration. The bar’s position on the timeline indicates the task’s start and end dates. By visualizing the project in this manner, project managers and team members can quickly grasp the overall project timeline, identify potential bottlenecks, and track progress.
Beyond basic task scheduling, Gantt charts often include additional information such as:
- Dependencies: Arrows connecting tasks indicate dependencies, meaning that one task must be completed before another can begin. This is crucial for understanding the sequence of events necessary for project completion.
- Milestones: Key checkpoints or deliverables are marked as milestones, providing significant points of progress throughout the project.
- Resources: The resources (people, equipment, etc.) assigned to each task can be displayed, allowing for resource allocation and management.
- Progress Tracking: The percentage of completion for each task can be visualized, giving a clear overview of the project’s current status.
Critical Path Methodology: The Heart of Efficient Project Management
The critical path method (CPM) is a technique used to identify the longest sequence of dependent tasks that determines the shortest possible project duration. This sequence is known as the critical path. Any delay in a task on the critical path will directly impact the project’s overall completion date. Conversely, tasks not on the critical path have some degree of “float” or “slack,” meaning they can be delayed slightly without affecting the project deadline.
Identifying the critical path is crucial for effective project management because it allows project managers to:
- Prioritize Tasks: Focus efforts and resources on the tasks that directly impact the project timeline.
- Minimize Delays: Closely monitor critical path tasks to identify and mitigate potential delays promptly.
- Optimize Resource Allocation: Allocate resources strategically to ensure critical path tasks are completed on time.
- Evaluate Trade-offs: Understand the impact of potential changes or delays on the overall project schedule.
Critical Path Visualization on a Gantt Chart
The power of the Gantt chart is amplified when combined with critical path visualization. Typically, tasks on the critical path are highlighted using a distinct color or style (e.g., red bars) to visually differentiate them from other tasks. This allows project managers to quickly identify the most important tasks and focus their attention accordingly. Some software also dynamically recalculates and updates the critical path visualization as progress is updated or changes are made to the schedule, providing a real-time view of project criticality.
Here’s how critical path visualization enhances the benefits of a Gantt chart:
- Immediate Identification: The highlighted critical path instantly draws attention to the most critical tasks, eliminating the need to manually analyze dependencies and timelines.
- Impact Assessment: By visualizing the critical path, it becomes easier to understand the ripple effect of any potential delays or changes to tasks on the critical path. This enables better decision-making regarding resource allocation and schedule adjustments.
- Improved Communication: The visually clear critical path facilitates communication among team members and stakeholders, ensuring everyone understands the project’s most critical aspects.
- Proactive Risk Management: Knowing which tasks are on the critical path allows for proactive risk assessment and mitigation. Project managers can identify potential risks associated with these tasks and develop contingency plans to minimize their impact on the project timeline.
Creating a Gantt Chart with Critical Path Visualization
Creating a Gantt chart with critical path visualization typically involves using project management software or online tools. These tools automate the process of calculating the critical path and visualizing it on the chart. Here’s a general outline of the steps involved:
- Define Tasks: Break down the project into a comprehensive list of individual tasks.
- Estimate Durations: Estimate the time required to complete each task.
- Establish Dependencies: Define the dependencies between tasks, specifying which tasks must be completed before others can begin.
- Assign Resources: Assign resources (people, equipment, etc.) to each task.
- Input Data into Gantt Chart Software: Enter the task details, durations, dependencies, and resource assignments into the chosen project management software.
- Calculate Critical Path: The software will automatically calculate the critical path based on the task durations and dependencies.
- Visualize Critical Path: The software will highlight the critical path tasks on the Gantt chart, typically using a distinct color or style.
- Monitor and Update: Regularly update the Gantt chart with progress information and any changes to the project schedule. The software will dynamically recalculate and update the critical path visualization as needed.
Benefits of Using a Gantt Chart with Critical Path
Using a Gantt chart with critical path visualization offers numerous benefits for project management, including:
- Improved Project Planning: The Gantt chart provides a visual representation of the project schedule, facilitating better planning and resource allocation.
- Enhanced Project Tracking: The Gantt chart allows for easy monitoring of project progress and identification of potential delays.
- Effective Communication: The Gantt chart serves as a valuable communication tool, ensuring all stakeholders are informed about the project’s status and critical path.
- Proactive Risk Management: The critical path visualization enables proactive identification and mitigation of potential risks.
- Optimized Resource Allocation: By focusing on critical path tasks, resources can be allocated more efficiently.
- Increased Project Success: By improving planning, tracking, and risk management, a Gantt chart with critical path visualization significantly increases the likelihood of project success.
In conclusion, a Gantt chart with critical path visualization is an invaluable tool for project managers seeking to plan, execute, and control projects effectively. Its visual clarity, coupled with the insights provided by the critical path method, empowers project teams to stay on track, mitigate risks, and ultimately deliver successful projects on time and within budget.
 1261×862 critical path excel spreadsheet template displaying critical from db-excel.com
  891×456 gantt chart critical path from knowledge-mc.aprika.com
  474×241 critical path excel gantt chart onepager express from www.onepager.com
 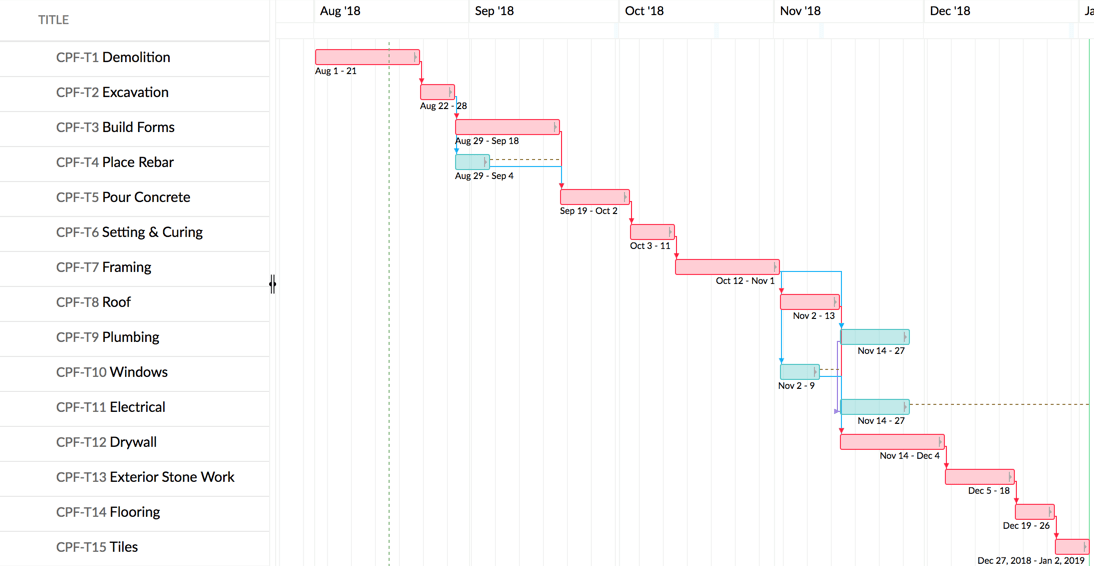 1094×566 critical path zoho projects from www.zoho.com
 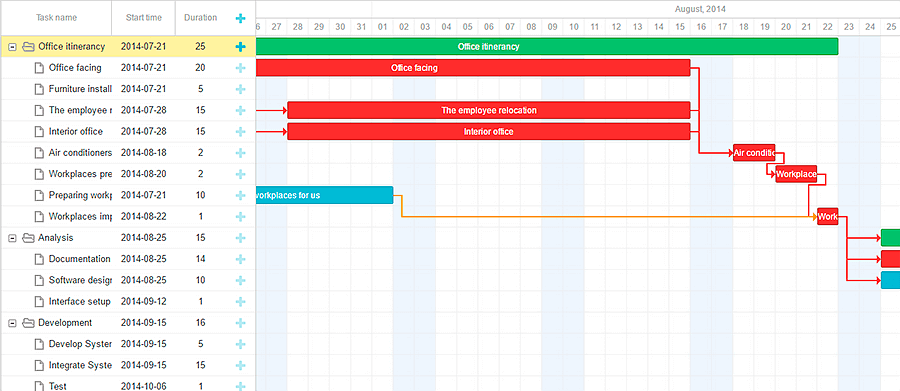 900×391 critical path method important gantt chart from dhtmlx.com
 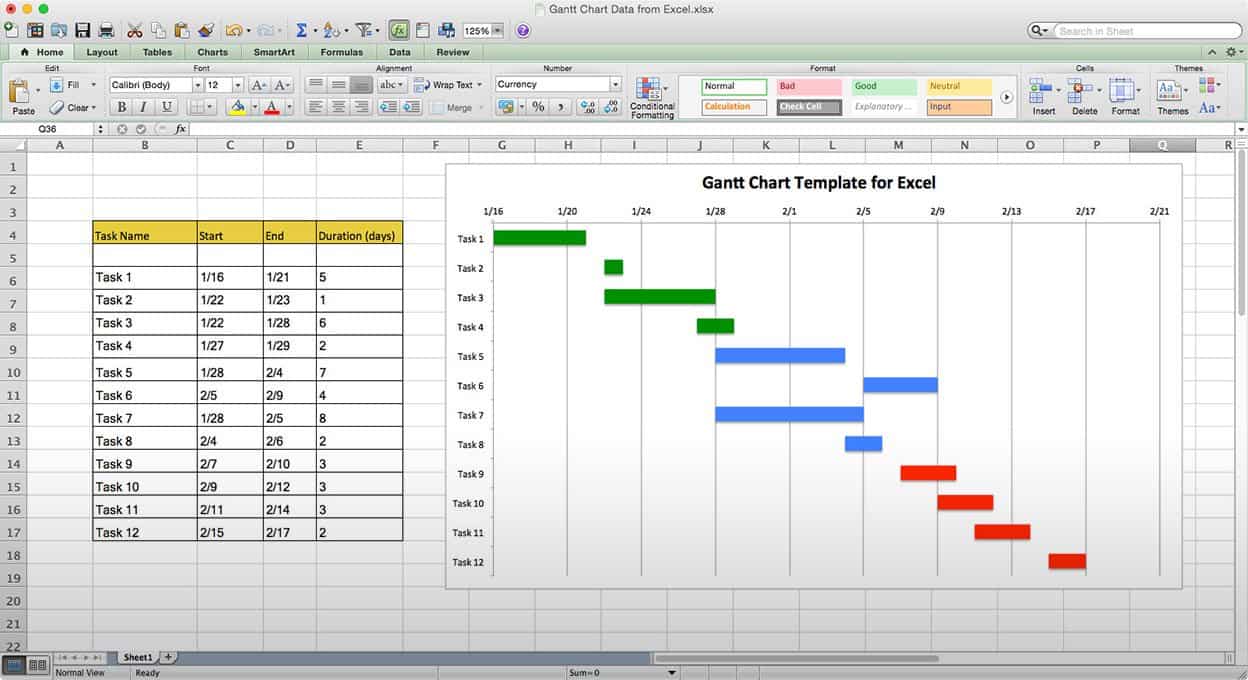 1248×680 critical path method construction smartsheet from www.smartsheet.com
  2108×846 critical paths gantt charts from www.chriscroft.co.uk
 Thank you for visiting Gantt Chart With Critical Path Visualization Template. There are a lot of beautiful templates out there, but it can be easy to feel like a lot of the best cost a ridiculous amount of money, require special design. And if at this time you are looking for information and ideas regarding the Gantt Chart With Critical Path Visualization Template then, you are in the perfect place. Get this Gantt Chart With Critical Path Visualization Template for free here. We hope this post Gantt Chart With Critical Path Visualization Template inspired you and help you what you are looking for.
Gantt Chart With Critical Path Visualization Template was posted in February 4, 2026 at 4:38 pm. If you wanna have it as yours, please click the Pictures and you will go to click right mouse then Save Image As and Click Save and download the Gantt Chart With Critical Path Visualization Template Picture.. Don’t forget to share this picture with others via Facebook, Twitter, Pinterest or other social medias! we do hope you'll get inspired by SampleTemplates123... Thanks again! If you have any DMCA issues on this post, please contact us!