Gantt Chart Template For Quarterly OKR Tracking
Gantt Chart Template for Quarterly OKR Tracking
Tracking Objectives and Key Results (OKRs) effectively requires a clear visualization of progress, deadlines, and dependencies. A Gantt chart provides an excellent framework for managing quarterly OKRs, allowing teams to monitor milestones, identify potential roadblocks, and ensure alignment towards achieving their goals. This document outlines a comprehensive Gantt chart template designed specifically for tracking quarterly OKRs.
Understanding the Benefits
Before diving into the template, let’s understand why using a Gantt chart for OKR tracking is beneficial:
- Visual Representation: A Gantt chart provides a visual overview of the entire OKR process, making it easy to understand the timeline, dependencies, and progress of each key result.
- Improved Planning: By mapping out tasks and dependencies, teams can better plan their resources and allocate time effectively.
- Enhanced Collaboration: A shared Gantt chart facilitates collaboration among team members by providing a common understanding of responsibilities and deadlines.
- Early Identification of Risks: The chart allows for the early identification of potential delays or bottlenecks, giving teams time to adjust their plans and mitigate risks.
- Progress Monitoring: The Gantt chart makes it easy to track progress against planned milestones, allowing teams to stay on track and make data-driven decisions.
- Increased Accountability: Clearly defined tasks and deadlines hold team members accountable for their responsibilities.
Gantt Chart Template Components
A well-designed Gantt chart template for OKR tracking should include the following components:
1. Objective
The overarching goal the team is trying to achieve. This should be clearly defined and measurable. For example: “Increase Customer Satisfaction.”
* Column in Gantt Chart: Objective Name
2. Key Results
Specific, measurable, achievable, relevant, and time-bound (SMART) metrics that demonstrate progress towards the Objective. For example: “Increase Net Promoter Score (NPS) from 60 to 75 by the end of Q3.”
* Column in Gantt Chart: Key Result Name
3. Tasks/Activities
The individual actions that need to be completed to achieve each key result. These should be broken down into manageable steps. For example: “Conduct customer surveys,” “Analyze survey results,” “Implement feedback-driven improvements.”
* Column in Gantt Chart: Task Name
4. Start Date
The date on which each task is scheduled to begin.
* Column in Gantt Chart: Start Date
5. End Date
The date on which each task is scheduled to be completed. This determines the task’s duration and its position on the Gantt chart timeline.
* Column in Gantt Chart: End Date
6. Duration
The estimated time it will take to complete each task, usually measured in days or weeks.
* Calculated Field (End Date – Start Date)
7. Assignee
The individual or team responsible for completing each task. This ensures accountability and clarity.
* Column in Gantt Chart: Assignee
8. Dependencies
Relationships between tasks, indicating which tasks must be completed before others can begin. This is crucial for identifying critical paths and preventing delays. For example, “Analyze survey results” cannot begin until “Conduct customer surveys” is complete.
* Column in Gantt Chart: Predecessor Task(s) (Specify task name or row number)
9. Status
A way to track the progress of each task. Common statuses include: “Not Started,” “In Progress,” “Completed,” and “Blocked.”
* Column in Gantt Chart: Status (Dropdown with options)
10. Percentage Complete
An indicator of how much of the task has been completed, expressed as a percentage.
* Column in Gantt Chart: % Complete (Enter a percentage)
11. Priority
A rating of the importance of each task, helping to prioritize efforts and allocate resources effectively. Common priority levels include: “High,” “Medium,” and “Low.”
* Column in Gantt Chart: Priority (Dropdown with options)
12. Notes/Comments
A space to add any relevant information or updates about each task, such as challenges faced, decisions made, or changes to the plan.
* Column in Gantt Chart: Notes
Using the Template: A Step-by-Step Guide
- Define Your OKRs: Start by clearly defining your Objectives and Key Results for the quarter. Ensure that they are SMART and aligned with the overall company goals.
- Break Down Key Results into Tasks: For each Key Result, identify the specific tasks that need to be completed to achieve it. Be as detailed as possible.
- Enter Data into the Gantt Chart: Populate the Gantt chart template with the information for each task, including the start date, end date, assignee, dependencies, and priority.
- Visualize the Timeline: Use the Gantt chart software to visualize the timeline and dependencies. Adjust the start and end dates as needed to optimize the schedule.
- Track Progress Regularly: Monitor the progress of each task regularly and update the status and percentage complete accordingly.
- Identify and Address Roadblocks: If any tasks are blocked or delayed, identify the root cause and take corrective action immediately.
- Communicate and Collaborate: Share the Gantt chart with the team and use it as a tool for communication and collaboration. Hold regular meetings to discuss progress and address any challenges.
- Review and Adjust: At the end of each week or sprint, review the Gantt chart and make any necessary adjustments to the plan. This may involve re-prioritizing tasks, re-assigning resources, or adjusting deadlines.
Choosing the Right Tool
Several tools can be used to create and manage Gantt charts, ranging from simple spreadsheets to dedicated project management software. Some popular options include:
- Microsoft Project: A comprehensive project management tool with advanced Gantt chart features.
- Asana: A popular work management platform with Gantt chart capabilities.
- Trello: A visual task management tool with a Power-Up that enables Gantt charts.
- Smartsheet: A spreadsheet-based project management tool with strong Gantt chart functionality.
- Google Sheets: A free, cloud-based spreadsheet program that can be used to create a basic Gantt chart.
The best tool for your team will depend on your specific needs and budget. Consider factors such as ease of use, features, collaboration capabilities, and cost when making your decision.
Conclusion
Using a Gantt chart template for quarterly OKR tracking is a powerful way to visualize progress, manage dependencies, and ensure that teams are aligned towards achieving their goals. By following the steps outlined in this document and choosing the right tool, organizations can improve their OKR performance and achieve greater success.
 1050×1360 quarterly okr template word google docs templatenet from www.template.net
  600×249 excel okr tracking template rising goal from risinggoal.com
  700×540 gantt chart template documents word excel from www.dexform.com
  720×540 gantt chart quarterly template from templates.rjuuc.edu.np
  1600×652 okr tracking template excel from templates.rjuuc.edu.np
  678×381 quarterly gantt chart brain powerpoint infographic template from pptxtemplates.com
  1200×800 quarterly gantt chart keynote template nulivo market from www.nulivo.com
  837×636 okr tracking template from templates.hilarious.edu.np
  1302×866 quarterly okrs template simplamo from simplamo.com
  1920×1080 okr dashboard template overview reporting weekdone from blog.weekdone.com
  1201×632 okr dashboard template from mungfali.com
  1374×926 okr tracking templates excel google sheets weekdone from weekdone.com
  2756×948 okr examples templates downloadable easy okr from www.how-to-okr.com
  1280×720 quarterly gantt chart design from slidesgeek.com
 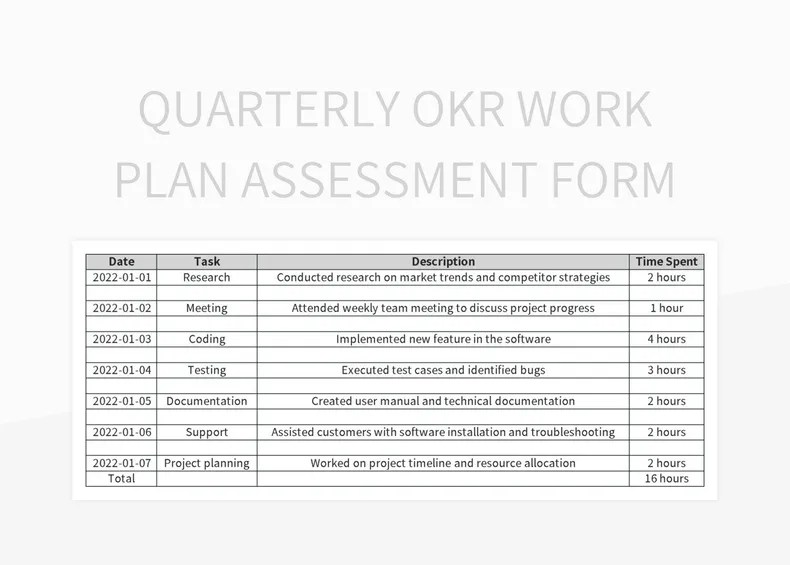 790×565 quarterly okr work plan assessment form excel template google from slidesdocs.com
  1530×2056 quarterly okr cycle guide template onstrategy from onstrategyhq.com
  1500×1125 excel performance okr trackersxlsx wps templates from template.wps.com
  1344×1029 okr format template from old.sermitsiaq.ag
 Thank you for visiting Gantt Chart Template For Quarterly OKR Tracking. There are a lot of beautiful templates out there, but it can be easy to feel like a lot of the best cost a ridiculous amount of money, require special design. And if at this time you are looking for information and ideas regarding the Gantt Chart Template For Quarterly OKR Tracking then, you are in the perfect place. Get this Gantt Chart Template For Quarterly OKR Tracking for free here. We hope this post Gantt Chart Template For Quarterly OKR Tracking inspired you and help you what you are looking for.
Gantt Chart Template For Quarterly OKR Tracking was posted in May 17, 2025 at 6:18 pm. If you wanna have it as yours, please click the Pictures and you will go to click right mouse then Save Image As and Click Save and download the Gantt Chart Template For Quarterly OKR Tracking Picture.. Don’t forget to share this picture with others via Facebook, Twitter, Pinterest or other social medias! we do hope you'll get inspired by SampleTemplates123... Thanks again! If you have any DMCA issues on this post, please contact us!
Related For Gantt Chart Template For Quarterly OKR Tracking
Google Sheets Gantt Chart Template
Gantt charts are indispensable tools for project management, providingEditable Gantt Chart Template For S
Editable Gantt Chart Template for Students Editable Gantt ChartGantt Chart Template For Wedding Pl
Wedding Planning Checklist Gantt Chart Template Wedding Planning Checklist