Project Scope Visualization Using Gantt Chart
Project Scope Visualization with Gantt Charts
A project’s scope defines the boundaries of what the project will deliver and what it will not deliver. Clearly defining and communicating this scope is crucial for project success. When the scope is ambiguous or poorly understood, projects are prone to scope creep, budget overruns, and missed deadlines. Effective visualization of the project scope ensures that all stakeholders – project managers, team members, clients, and sponsors – have a shared understanding of the project’s goals, deliverables, and timeline.
One of the most effective tools for visualizing project scope is the Gantt chart. A Gantt chart is a horizontal bar chart that visually represents a project schedule. It lists the tasks to be performed on the vertical axis and displays their corresponding start and end dates on the horizontal axis. This simple but powerful visual representation allows for a clear understanding of the project’s timeline, dependencies, and progress.
How Gantt Charts Visualize Project Scope
Gantt charts directly contribute to scope visualization in several key ways:
- Task Breakdown and Definition: Creating a Gantt chart requires breaking down the overall project scope into smaller, manageable tasks. This decomposition process forces the project manager to thoroughly define each task and its associated deliverables. Each bar on the Gantt chart represents a specific task, clearly outlining what needs to be accomplished within the project’s scope.
- Timeline and Duration: The Gantt chart visually displays the timeline for each task, showing its start and end dates. This allows stakeholders to understand the duration of each component of the project and how they contribute to the overall project timeline. The visual representation of timelines helps manage expectations regarding the time required to complete different aspects of the scope.
- Dependencies and Relationships: Gantt charts effectively illustrate task dependencies. By connecting tasks with arrows or lines, the chart shows which tasks must be completed before others can begin. This highlights the critical path, the sequence of tasks that directly impacts the project’s completion date. Visualizing dependencies helps stakeholders understand how changes in one task can impact the entire project scope and timeline.
- Milestones and Deliverables: Milestones, representing significant achievements or the completion of key deliverables, can be easily marked on a Gantt chart. These milestones serve as visual checkpoints, allowing stakeholders to track progress against the defined scope. Clear visualization of milestones keeps the team focused on delivering specific outcomes within the project’s scope.
- Resource Allocation (Indirectly): While Gantt charts don’t directly depict resource allocation, they can be used in conjunction with resource management tools to visualize the allocation of resources to specific tasks. By knowing the tasks and their timelines, project managers can allocate resources effectively and ensure that each aspect of the scope is adequately supported. This connection to resources reinforces the feasibility of achieving the defined scope.
- Identification of Potential Bottlenecks: The Gantt chart can reveal potential bottlenecks in the project timeline. By visualizing dependencies and task durations, project managers can identify tasks that are likely to become critical constraints. This allows them to proactively address potential issues and prevent delays that could impact the project scope.
Benefits of Using Gantt Charts for Scope Visualization
Utilizing Gantt charts for project scope visualization offers numerous benefits:
- Improved Communication: Gantt charts provide a common visual language that facilitates communication between all stakeholders. The chart allows everyone to see the project’s scope, timeline, and dependencies in a clear and concise manner, minimizing misunderstandings and ensuring alignment.
- Enhanced Collaboration: By providing a shared understanding of the project’s scope and timeline, Gantt charts foster collaboration among team members. Team members can see how their individual tasks contribute to the overall project goals and how their work impacts other team members.
- Proactive Risk Management: Visualizing the project scope with a Gantt chart enables project managers to identify and mitigate potential risks early on. By seeing the dependencies and critical path, they can anticipate potential delays and resource constraints and take corrective action before they impact the project scope.
- Effective Scope Management: Gantt charts help in tracking the progress of tasks and deliverables, allowing project managers to identify any deviations from the planned scope. This enables them to take corrective action promptly, preventing scope creep and ensuring that the project stays on track.
- Better Decision-Making: The visual representation provided by Gantt charts enables project managers to make more informed decisions about resource allocation, task prioritization, and risk mitigation.
Limitations of Gantt Charts
While Gantt charts are powerful tools, they also have limitations:
- Complexity with Large Projects: For large and complex projects with numerous tasks and dependencies, Gantt charts can become unwieldy and difficult to read. In such cases, alternative visualization techniques or more sophisticated project management software might be necessary.
- Static Representation: Gantt charts typically present a static view of the project plan. While they can be updated to reflect changes, they may not always be real-time representations of the project’s progress. More dynamic project management tools may be needed for projects that require constant monitoring and adjustments.
- Limited Information: Gantt charts primarily focus on the timeline and tasks. They may not provide sufficient information about other critical aspects of the project, such as resource allocation, budget, and risk management. These aspects need to be managed using other tools and processes in conjunction with the Gantt chart.
Conclusion
Gantt charts are an invaluable tool for visualizing project scope. By clearly depicting tasks, timelines, dependencies, and milestones, they ensure that all stakeholders have a shared understanding of the project’s goals and deliverables. While Gantt charts have limitations, their benefits in terms of improved communication, enhanced collaboration, and proactive risk management make them an essential part of any project manager’s toolkit. By effectively utilizing Gantt charts, project teams can significantly increase their chances of delivering successful projects that meet or exceed stakeholder expectations.
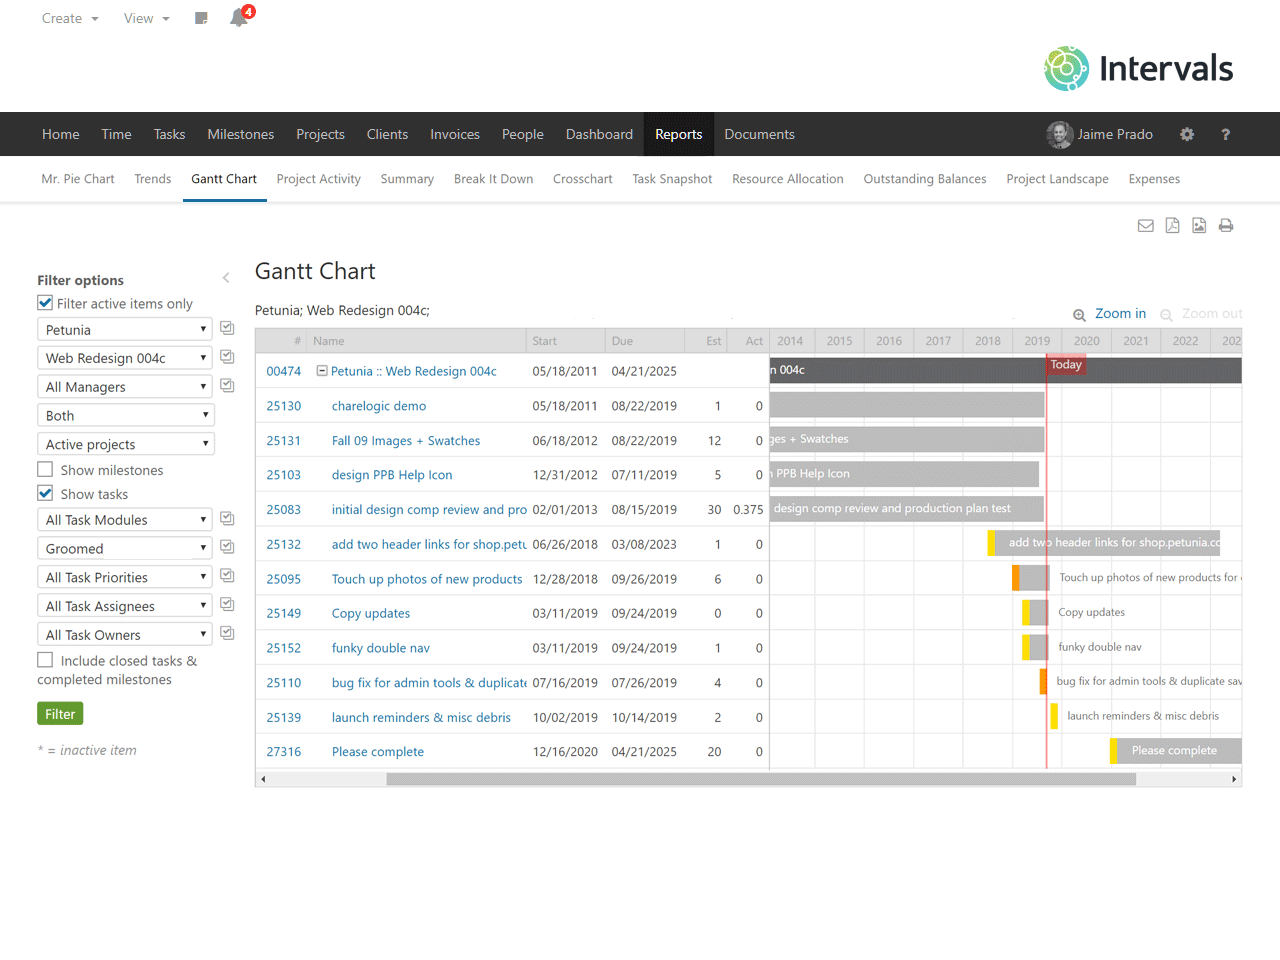 1280×960 visualize project timelines gantt chart intervals blog from www.myintervals.com
  1504×1018 google visualisation gantt chart omniscope center from help.visokio.com
  820×316 gantt chart project diagram microsoft visio png xpx gantt from favpng.com
 Thank you for visiting Project Scope Visualization Using Gantt Chart. There are a lot of beautiful templates out there, but it can be easy to feel like a lot of the best cost a ridiculous amount of money, require special design. And if at this time you are looking for information and ideas regarding the Project Scope Visualization Using Gantt Chart then, you are in the perfect place. Get this Project Scope Visualization Using Gantt Chart for free here. We hope this post Project Scope Visualization Using Gantt Chart inspired you and help you what you are looking for.
Project Scope Visualization Using Gantt Chart was posted in September 7, 2025 at 10:20 pm. If you wanna have it as yours, please click the Pictures and you will go to click right mouse then Save Image As and Click Save and download the Project Scope Visualization Using Gantt Chart Picture.. Don’t forget to share this picture with others via Facebook, Twitter, Pinterest or other social medias! we do hope you'll get inspired by SampleTemplates123... Thanks again! If you have any DMCA issues on this post, please contact us!