Minimalist Gantt Chart Template Excel Format
Minimalist Gantt Chart Template in Excel: Streamline Project Management
In the fast-paced world of project management, clarity and efficiency are paramount. A well-designed Gantt chart is an indispensable tool for visualizing project timelines, dependencies, and progress. While sophisticated project management software exists, Excel remains a popular choice for its accessibility and familiarity. A minimalist Gantt chart template in Excel offers a powerful yet simple solution for planning and tracking projects of varying complexities.
Why Choose a Minimalist Gantt Chart?
The core appeal of a minimalist Gantt chart lies in its simplicity. Unlike feature-rich templates cluttered with unnecessary details, a minimalist approach focuses on the essential elements required for effective project management. This translates to several advantages:
- Ease of Use: Minimalist templates are intuitive and easy to understand, even for those new to project management. The reduced complexity makes them quick to set up and update.
- Improved Clarity: By focusing on the most crucial information – task names, start and end dates, and progress – minimalist charts enhance visual clarity. This allows project stakeholders to quickly grasp the project’s overall status and identify potential bottlenecks.
- Faster Loading and Performance: Excel files with simpler formatting and fewer formulas tend to load and perform faster. This is especially beneficial for large projects with numerous tasks and dependencies.
- Customization: A minimalist template provides a clean slate for customization. You can easily tailor the chart to your specific project needs by adding or modifying elements as required.
- Reduced Risk of Errors: Complex formulas and intricate formatting increase the likelihood of errors. A minimalist template reduces this risk, ensuring data accuracy and reliability.
Key Elements of a Minimalist Gantt Chart Template in Excel
A well-designed minimalist Gantt chart should include the following essential elements:
- Task Name/Description: A clear and concise description of each task within the project.
- Start Date: The date on which the task is scheduled to begin.
- End Date: The date on which the task is scheduled to be completed.
- Duration: The calculated duration of the task, typically in days or weeks. This is automatically calculated based on the start and end dates.
- Progress (% Complete): A percentage indicating the completion status of the task. This is usually represented visually as a progress bar within the Gantt chart.
- Dependencies (Optional): Columns or visual cues (e.g., arrows) to indicate dependencies between tasks. This helps to identify critical path activities.
- Gantt Chart Visualization: The visual representation of the project timeline, with each task represented as a bar extending from its start date to its end date. The length of the bar corresponds to the task’s duration.
- Date Axis: A horizontal axis displaying the project timeline, typically spanning from the project start date to the project end date.
Creating a Minimalist Gantt Chart Template in Excel
You can create a minimalist Gantt chart template in Excel using conditional formatting and simple formulas. Here’s a step-by-step guide:
- Set up the Data Table: In an Excel sheet, create columns for Task Name, Start Date, End Date, Duration, and % Complete. Populate these columns with the relevant data for your project.
- Calculate Duration: In the Duration column, use the formula `=End Date – Start Date` to automatically calculate the duration of each task. Format the column as a number.
- Create the Date Axis: Determine the project’s start and end dates. Create a horizontal row of dates spanning from the project start date to the project end date. You can use formulas like `=A1+1` to increment the date in each subsequent cell. Format these cells to display only the day of the month (e.g., “d”).
- Apply Conditional Formatting: This is the core of the Gantt chart visualization. Select the range of cells corresponding to the project timeline (the area where the Gantt chart bars will appear). Go to “Conditional Formatting” in the “Home” tab and choose “New Rule.”
- Use a Formula to Determine Formatting: In the “New Formatting Rule” dialog box, select “Use a formula to determine which cells to format.” Enter a formula that checks if the date in the date axis row falls within the start and end dates of each task. For example, if your start dates are in column B, end dates in column C, and the first date in the date axis is in cell E1, the formula might look like this: `=AND(E$1>=$B2, E$1<=$C2)`. Remember to adjust the cell references to match your specific spreadsheet.
- Choose Formatting Options: Click the “Format” button and choose a fill color for the cells within the Gantt chart bars. This color will represent the task’s timeline. You can also adjust the font color and other formatting options as desired.
- Add Progress Bars: To visually represent the progress of each task, you can use conditional formatting again. Select the same range of cells you used for the Gantt chart bars. Go to “Conditional Formatting” and choose “Data Bars.” Select a color for the progress bar. Customize the data bar’s appearance (e.g., gradient fill, border) to match your preferences. Adjust the “Manage Rules” settings so that the data bar uses the “% Complete” column as its source. You might need to add a helper column if your “% Complete” is not a number between 0 and 1.
- Add Labels and Formatting: Add labels to the axes and format the chart to improve readability. Use borders, colors, and font styles to enhance the visual appeal.
- Consider Dependencies: While maintaining a minimalist approach, you can optionally add a column for dependencies (predecessor tasks). You can then use visual cues, such as arrows connecting related tasks, to illustrate these dependencies. These arrows can be added manually using Excel’s drawing tools or by using formulas to dynamically display arrows based on the dependency information.
Tips for Maintaining a Minimalist Approach
- Resist Over-Complication: Focus on the essential elements and avoid adding unnecessary features.
- Use Clear and Concise Language: Keep task descriptions brief and to the point.
- Choose a Simple Color Palette: Select a limited number of colors to avoid visual clutter.
- Avoid Excessive Formatting: Use formatting sparingly to highlight important information.
- Regularly Review and Update: Keep the Gantt chart updated with the latest project progress.
Conclusion
A minimalist Gantt chart template in Excel provides a powerful and accessible solution for project planning and tracking. By focusing on the essential elements and avoiding unnecessary complexities, it offers improved clarity, ease of use, and enhanced efficiency. Whether you’re managing a small personal project or a larger team endeavor, a minimalist Gantt chart can help you stay organized, on track, and in control.
 1280×720 simple gantt chart excel chart template microsoft office gantt from db-excel.com
 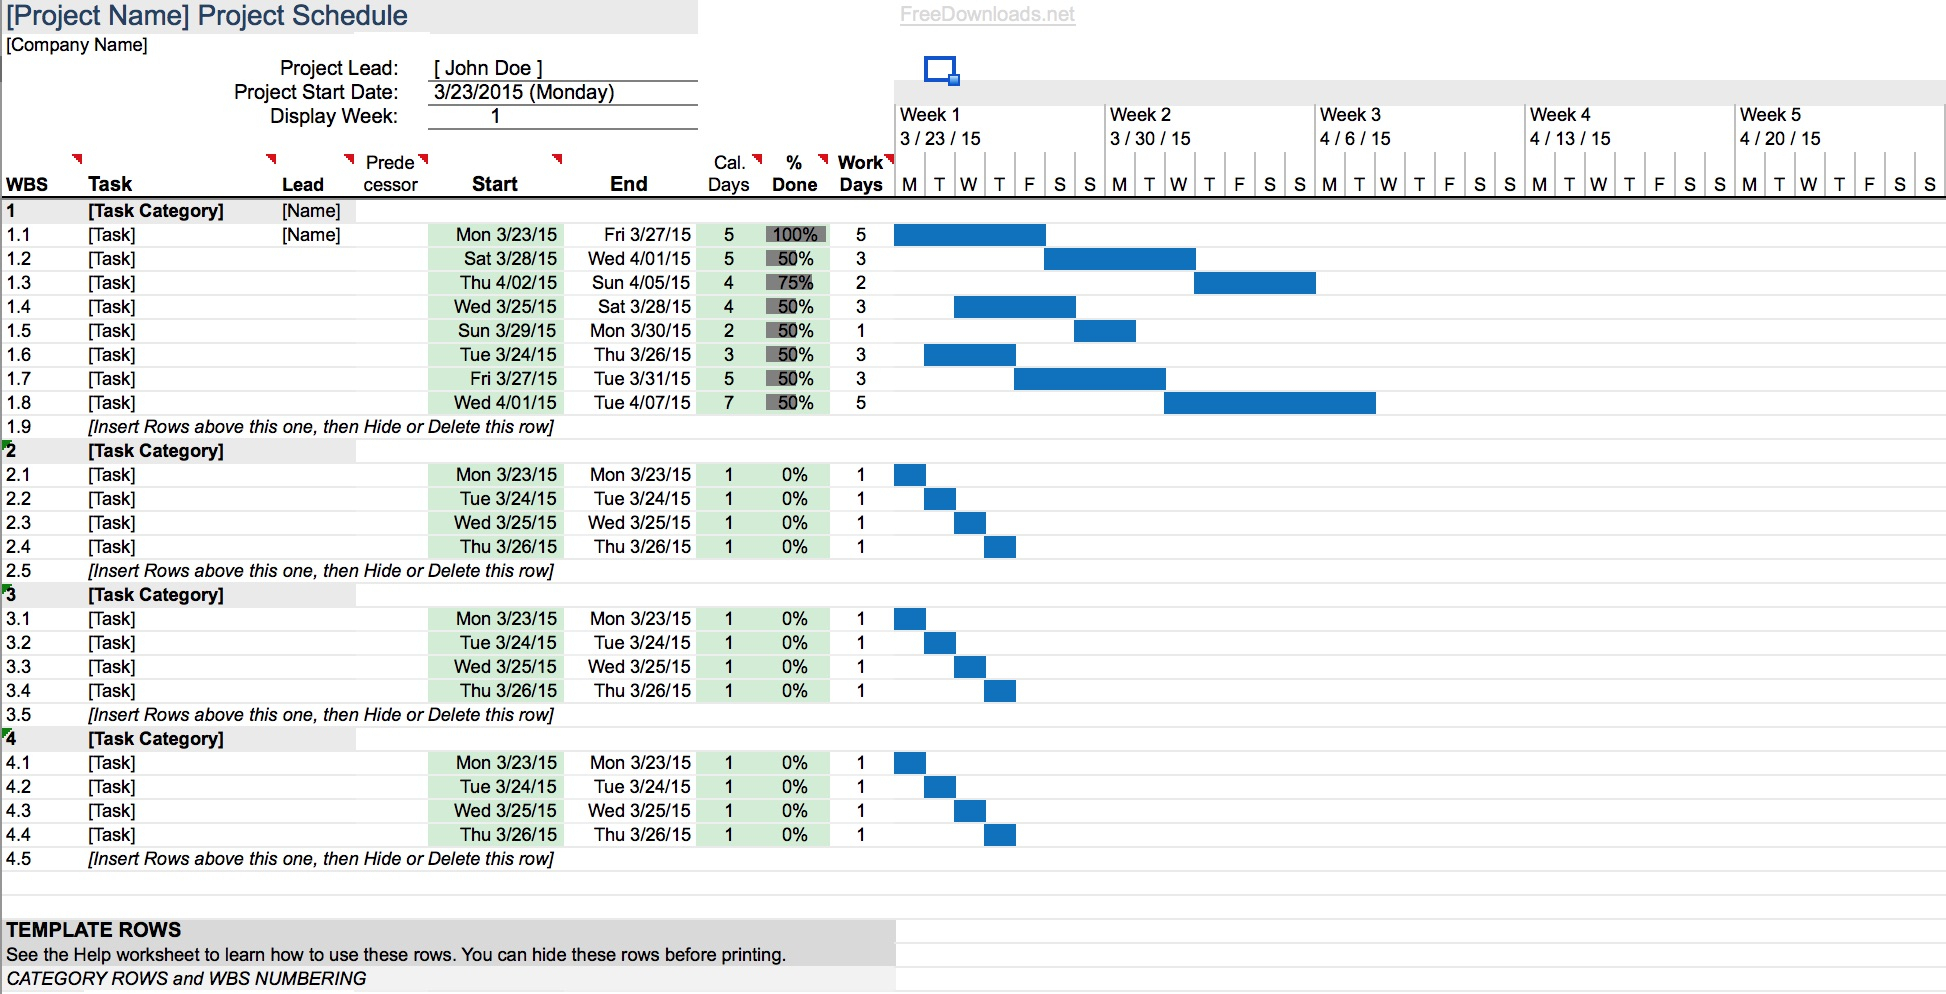 1946×994 simple gantt chart template excel freedownloads from db-excel.com
  0 x 0 gantt chart excel template teamgantt from www.teamgantt.com
  1248×680 gantt chart template excel spreadshee gantt from db-excel.com
 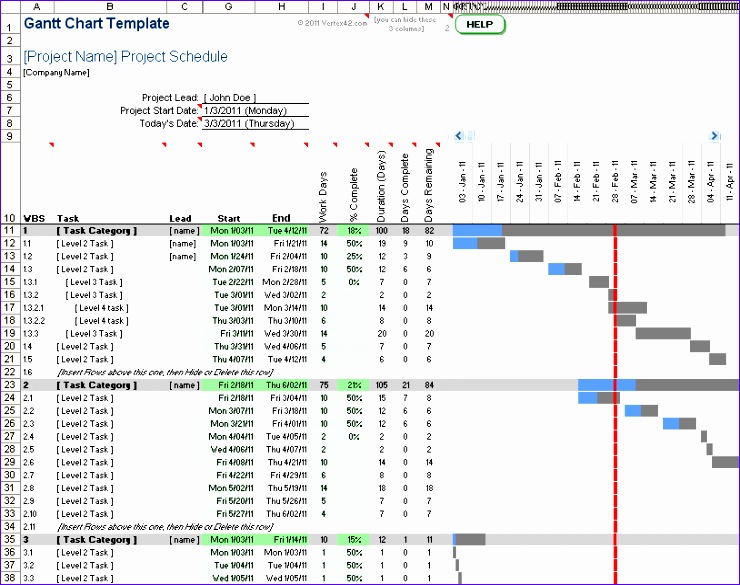 740×585 excel simple gantt chart template excel templates from www.exceltemplate123.us
  700×1053 blue simple monthly gantt chart excel template excel xls template from pikbest.com
 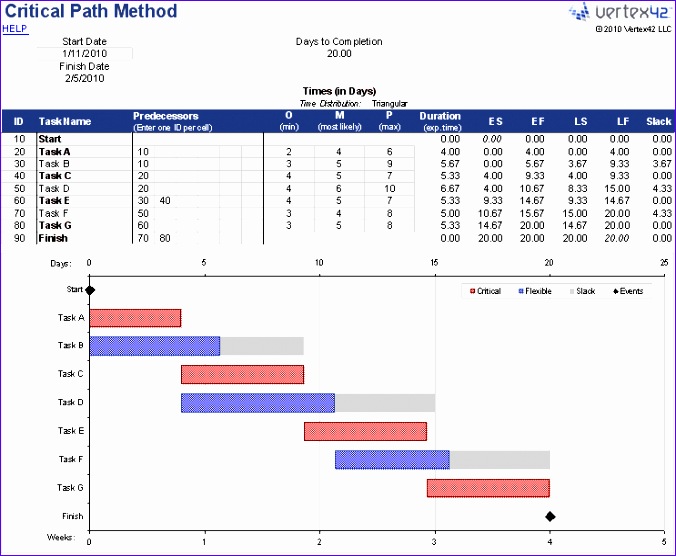 676×556 simple gantt chart template excel excel templates from www.exceltemplate123.us
  1634×986 simple excel gantt chart template excel templates excel from www.exceltemplate123.us
 Thank you for visiting Minimalist Gantt Chart Template Excel Format. There are a lot of beautiful templates out there, but it can be easy to feel like a lot of the best cost a ridiculous amount of money, require special design. And if at this time you are looking for information and ideas regarding the Minimalist Gantt Chart Template Excel Format then, you are in the perfect place. Get this Minimalist Gantt Chart Template Excel Format for free here. We hope this post Minimalist Gantt Chart Template Excel Format inspired you and help you what you are looking for.
Minimalist Gantt Chart Template Excel Format was posted in November 7, 2025 at 4:11 am. If you wanna have it as yours, please click the Pictures and you will go to click right mouse then Save Image As and Click Save and download the Minimalist Gantt Chart Template Excel Format Picture.. Don’t forget to share this picture with others via Facebook, Twitter, Pinterest or other social medias! we do hope you'll get inspired by SampleTemplates123... Thanks again! If you have any DMCA issues on this post, please contact us!