Eisenhower Matrix Integrated Gantt Chart
Eisenhower Matrix Gantt Chart: Prioritized Project Management
In the realm of project management, effectively prioritizing tasks is paramount to success. Time management techniques like the Eisenhower Matrix can be powerful tools, but their impact amplifies significantly when integrated with a visual scheduling method such as the Gantt chart. Combining these approaches results in a dynamic system that not only helps prioritize tasks but also structures them within a project timeline for optimum efficiency and clarity.
Understanding the Eisenhower Matrix
Also known as the Urgent-Important Matrix, the Eisenhower Matrix, popularized by Dwight D. Eisenhower, is a decision-making tool that categorizes tasks based on their urgency and importance. It’s essentially a 2×2 grid, creating four distinct quadrants:
- Quadrant 1: Urgent and Important (Do First) These tasks require immediate attention. They are typically crises, pressing problems, or deadline-driven activities. Examples include dealing with a major system outage, resolving a critical client issue, or completing a report due today.
- Quadrant 2: Important but Not Urgent (Schedule) These are the tasks that contribute to long-term goals and prevent problems from arising. They include planning, building relationships, exercise, preventative maintenance, and professional development. Schedule time for these activities because procrastination in this quadrant often leads to tasks migrating to Quadrant 1.
- Quadrant 3: Urgent but Not Important (Delegate) These tasks demand immediate attention but don’t contribute to your overall goals. They are often interruptions, some meetings, or other people’s minor requests. Delegate these tasks to others where possible, freeing up time for higher-priority activities.
- Quadrant 4: Not Urgent and Not Important (Eliminate) These tasks are time-wasters that offer little value and should be eliminated entirely. Examples include mindless browsing, excessive social media usage, or trivial activities that don’t contribute to any meaningful outcome.
Gantt Charts: Visualizing the Project Timeline
A Gantt chart is a visual representation of a project schedule. It lists tasks to be performed on the vertical axis and time intervals on the horizontal axis. Each task is represented by a bar, the length of which corresponds to its duration. Gantt charts provide a clear overview of project progress, dependencies, and deadlines, facilitating better planning, coordination, and tracking.
Integrating the Eisenhower Matrix with a Gantt Chart
The true power emerges when the Eisenhower Matrix’s prioritization framework is overlaid onto the visual structure of a Gantt chart. This integration provides several key advantages:
- Enhanced Prioritization within the Timeline: Instead of simply listing tasks on the Gantt chart, each task is first assigned to a quadrant of the Eisenhower Matrix. This prioritization then dictates the order in which tasks are scheduled and executed. Urgent and important tasks (Quadrant 1) are placed at the forefront of the timeline, followed by scheduled important tasks (Quadrant 2), delegated urgent tasks (Quadrant 3), and, ideally, the elimination of any tasks in Quadrant 4.
- Improved Resource Allocation: By knowing the priority of each task, project managers can allocate resources (personnel, budget, equipment) more effectively. Tasks in Quadrant 1 receive the necessary resources to ensure their timely completion, while resources for Quadrant 2 tasks are proactively planned. Delegation of Quadrant 3 tasks frees up resources to focus on high-impact activities.
- Clearer Project Overview: The integrated Gantt chart visually communicates the prioritized project plan to the entire team. This transparency ensures that everyone understands which tasks are most critical and how their individual contributions fit into the overall project timeline.
- Proactive Risk Management: By focusing on Quadrant 2 tasks (important but not urgent), the integrated approach promotes proactive risk management. Identifying potential issues early and implementing preventative measures reduces the likelihood of crises and delays. This prevents tasks from unexpectedly migrating to the urgent and important quadrant (Quadrant 1).
- Increased Productivity: By eliminating time-wasting activities (Quadrant 4), the team can focus on tasks that truly contribute to project goals. This improves productivity and efficiency, leading to faster project completion and better results.
- Better Time Management: The system forces a conscious effort to schedule time for important, non-urgent tasks (Quadrant 2). This proactive approach prevents these tasks from becoming urgent crises and promotes a more balanced workload.
Implementing the Integrated Approach
To successfully implement the Eisenhower Matrix Gantt chart, follow these steps:
- List All Project Tasks: Begin by creating a comprehensive list of all tasks required to complete the project.
- Assign Tasks to Eisenhower Matrix Quadrants: Evaluate each task based on its urgency and importance, assigning it to the appropriate quadrant of the Eisenhower Matrix. Be honest and realistic in your assessment.
- Create the Gantt Chart: Construct a Gantt chart, listing the tasks on the vertical axis.
- Prioritize Tasks on the Gantt Chart: Arrange the tasks on the Gantt chart according to their quadrant assignment. Quadrant 1 tasks should be at the top, followed by Quadrant 2, then delegated Quadrant 3 tasks, and ideally, Quadrant 4 tasks are removed altogether.
- Assign Task Durations: Estimate the duration of each task and represent it as a bar on the Gantt chart.
- Identify Dependencies: Identify any dependencies between tasks (e.g., Task B cannot start until Task A is completed). Use arrows or other visual cues to represent these dependencies on the Gantt chart.
- Allocate Resources: Assign resources (personnel, budget, equipment) to each task based on its priority and duration.
- Monitor Progress and Adjust: Regularly monitor the progress of each task and make adjustments to the Gantt chart as needed. As project needs shift, re-evaluate the quadrant assignment of tasks and update the schedule accordingly.
Conclusion
The Eisenhower Matrix and Gantt charts are powerful tools individually. However, their combined effect creates a robust project management methodology. By integrating the Eisenhower Matrix’s prioritization framework into the Gantt chart’s visual timeline, project managers can create clear, prioritized project plans, allocate resources effectively, manage risks proactively, and improve overall team productivity. This integrated approach leads to better project outcomes, increased efficiency, and reduced stress for everyone involved.
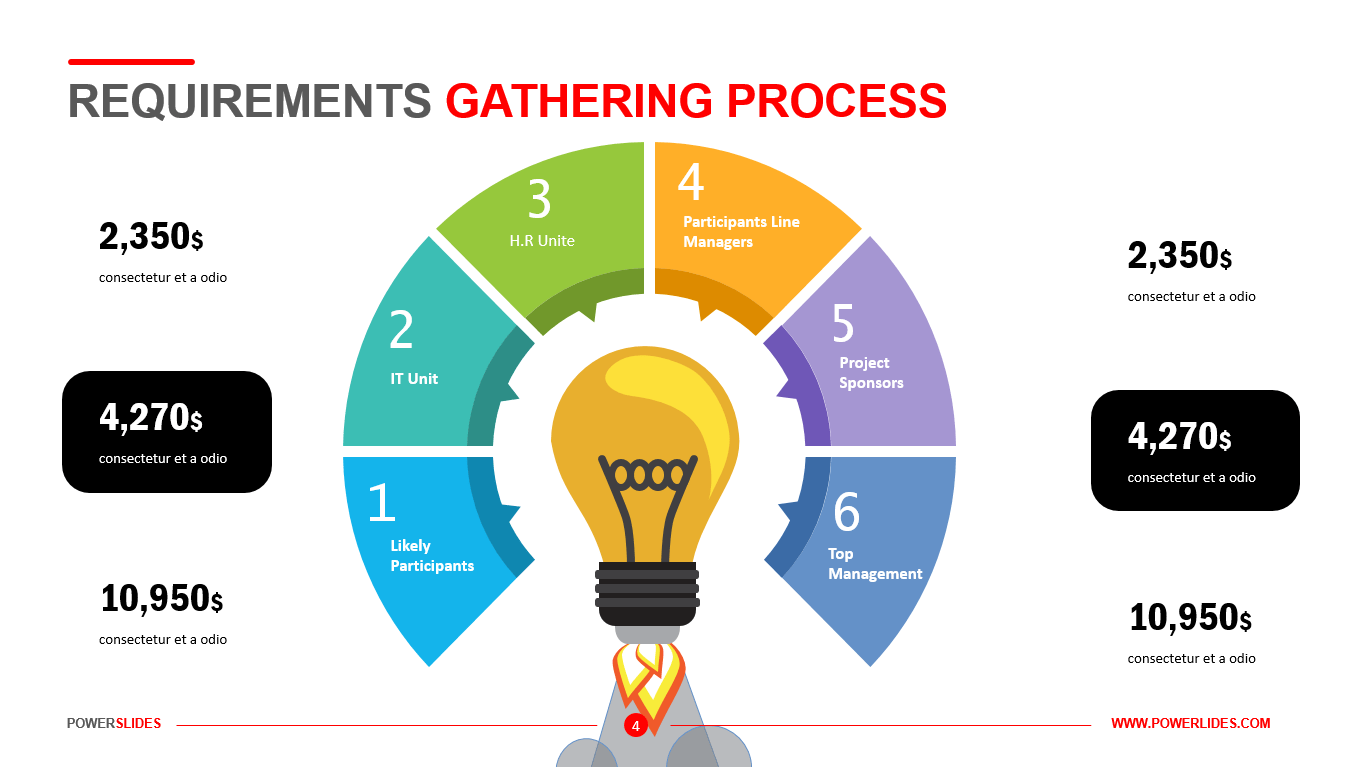 1365×767 eisenhower matrix template powerslides from www.powerslides.com
  1140×641 eisenhower matrix template milanote from milanote.com
  600×680 eisenhower matrix productivity from alyjuma.com
  1024×795 understanding eisenhower matrix epipheniecom from epiphenie.com
  2000×2000 eisenhower matrix work smarter filtergrade from filtergrade.com
 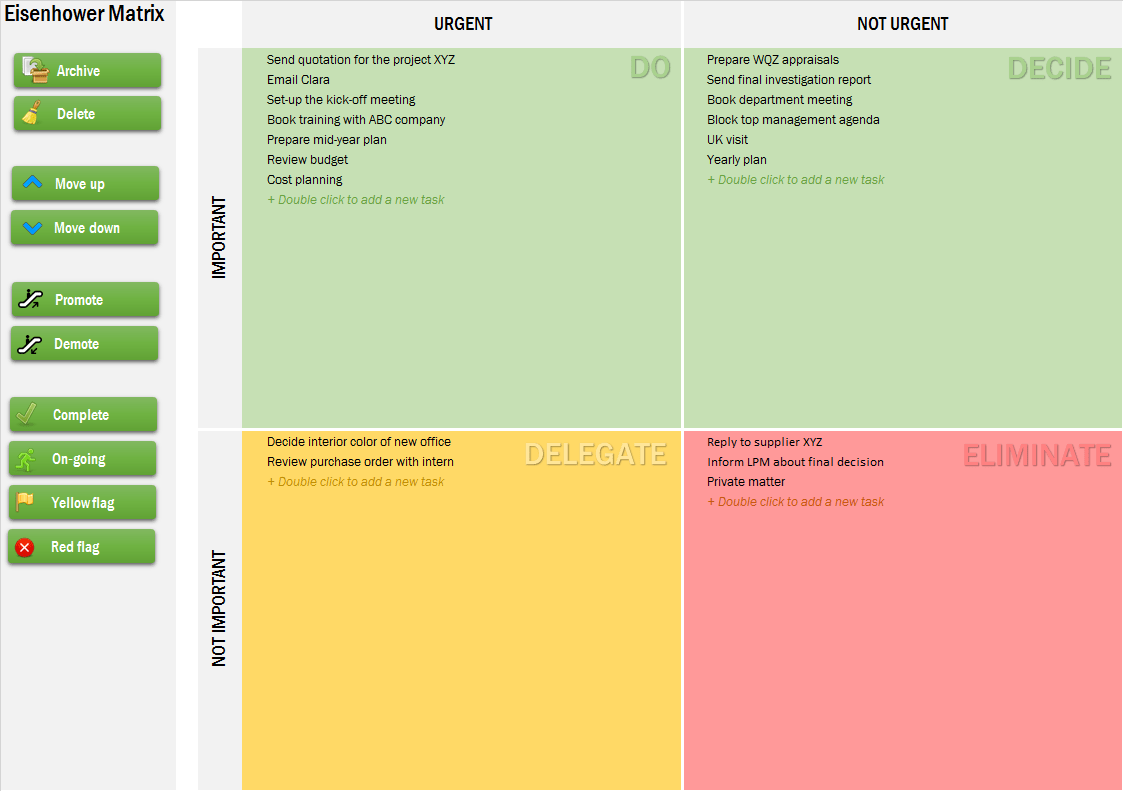 1123×791 eisenhower matrix management tools from mgt-tools.com
 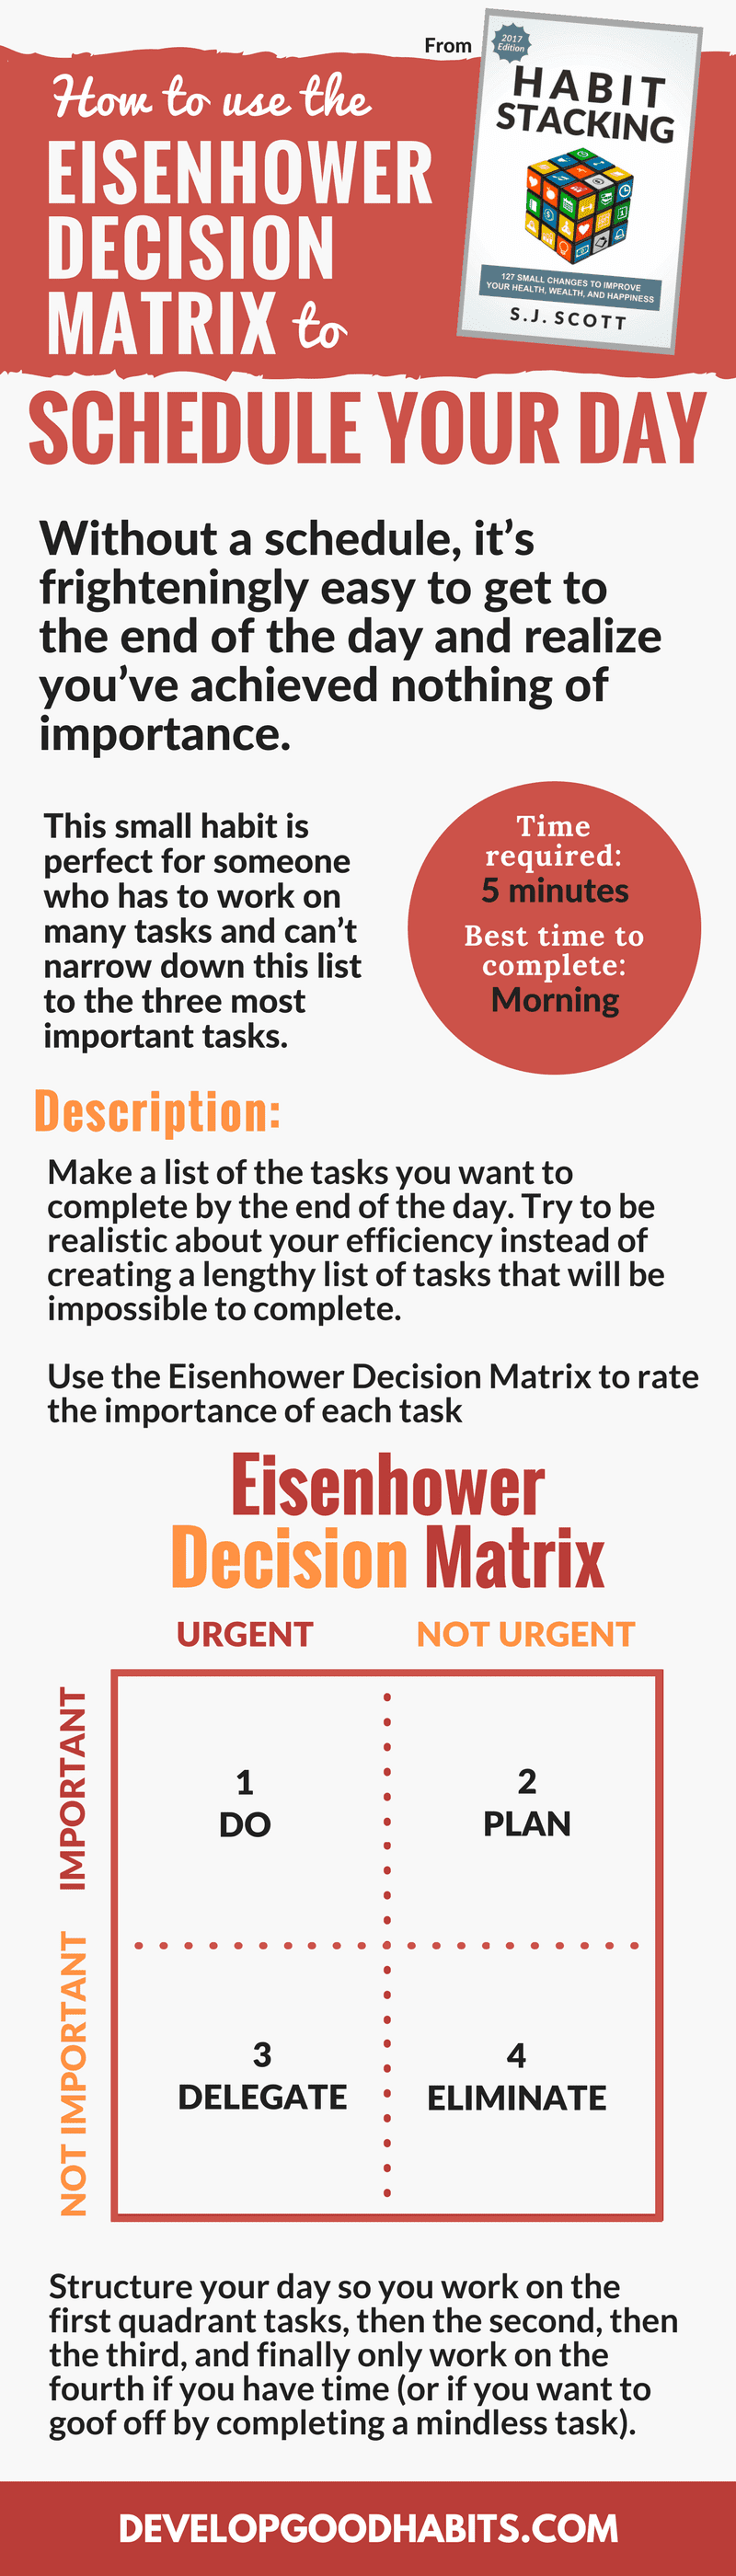 800×2800 eisenhower matrix decisions whats urgent important from www.developgoodhabits.com
 Thank you for visiting Eisenhower Matrix Integrated Gantt Chart. There are a lot of beautiful templates out there, but it can be easy to feel like a lot of the best cost a ridiculous amount of money, require special design. And if at this time you are looking for information and ideas regarding the Eisenhower Matrix Integrated Gantt Chart then, you are in the perfect place. Get this Eisenhower Matrix Integrated Gantt Chart for free here. We hope this post Eisenhower Matrix Integrated Gantt Chart inspired you and help you what you are looking for.
Eisenhower Matrix Integrated Gantt Chart was posted in August 3, 2025 at 2:32 am. If you wanna have it as yours, please click the Pictures and you will go to click right mouse then Save Image As and Click Save and download the Eisenhower Matrix Integrated Gantt Chart Picture.. Don’t forget to share this picture with others via Facebook, Twitter, Pinterest or other social medias! we do hope you'll get inspired by SampleTemplates123... Thanks again! If you have any DMCA issues on this post, please contact us!