Time Management Gantt Template Excel
Gantt Chart Excel Template: Your Key to Time Management
Effective time management is crucial for the successful completion of any project, regardless of its size or complexity. A Gantt chart, a visual representation of a project schedule, is an invaluable tool for planning, tracking, and managing tasks over time. While specialized project management software exists, an Excel-based Gantt chart template offers a readily accessible and customizable solution for individuals and small teams.
What is a Gantt Chart?
A Gantt chart is essentially a horizontal bar chart that visually depicts a project timeline. It breaks down a project into individual tasks, outlining their start and end dates. The chart also illustrates task dependencies, milestones, and resource allocation, providing a clear overview of the project’s progress.
Why Use an Excel Gantt Chart Template?
Excel offers several advantages for creating and using Gantt charts:
- Accessibility: Most computers already have Excel installed, eliminating the need for purchasing specialized software.
- Familiarity: Many individuals are already familiar with Excel’s interface, making it easy to learn and use.
- Customization: Excel allows for a high degree of customization, allowing you to tailor the Gantt chart to your specific project needs. You can modify colors, fonts, add conditional formatting, and incorporate formulas for dynamic calculations.
- Cost-Effective: Excel templates are often free or relatively inexpensive compared to dedicated project management software.
- Collaboration: Excel files can be easily shared and collaborated on, making it a viable option for small teams.
Key Components of an Excel Gantt Chart Template
A well-designed Gantt chart template in Excel typically includes the following components:
- Task List: A column listing all the tasks required for the project. This should be organized logically, possibly broken down into phases or categories.
- Start Date: The planned start date for each task.
- End Date: The planned end date for each task.
- Duration: Calculated automatically based on the start and end dates, representing the time required to complete each task.
- Dependencies: Indicates relationships between tasks, showing which tasks must be completed before others can begin.
- Progress: A visual representation of the percentage of completion for each task.
- Chart Area: The graphical representation of the timeline, where bars visually depict the duration of each task.
- Milestones: Significant checkpoints in the project timeline, visually marked on the chart.
- Resources: Optionally, a column to assign specific individuals or teams to each task.
How to Use an Excel Gantt Chart Template
Here’s a step-by-step guide on using an Excel Gantt chart template:
- Choose a Template: Search online for a free or paid Excel Gantt chart template that suits your project’s needs. Many reputable websites offer downloadable templates. Look for templates with clear instructions and good customization options.
- Populate the Task List: Replace the placeholder tasks with your project’s specific tasks. Organize them logically and break down large tasks into smaller, more manageable subtasks.
- Enter Start and End Dates: Enter the planned start and end dates for each task. Ensure that the template automatically calculates the duration based on these dates.
- Define Dependencies: Establish dependencies between tasks. Some templates allow you to visually link tasks, while others use a column to specify the predecessor task(s). This is crucial for understanding the critical path.
- Track Progress: As tasks are completed, update the progress column to reflect the percentage of completion. The chart should automatically update to reflect the progress of each task.
- Customize the Chart: Modify the chart’s appearance to your liking. Change colors, fonts, and add gridlines to improve readability. You can also add milestones and resource assignments.
- Regularly Update the Chart: The Gantt chart is a dynamic tool. Regularly update it with the latest information on task progress, delays, and changes to the schedule. This ensures that the chart remains accurate and useful.
Advanced Tips for Using Excel Gantt Charts
- Conditional Formatting: Use conditional formatting to highlight critical tasks, overdue tasks, or tasks nearing completion. This can provide a quick visual overview of the project’s status.
- Formulas for Automation: Leverage Excel’s formulas to automate calculations, such as calculating the overall project completion percentage or identifying the critical path.
- Milestone Tracking: Clearly mark and track milestones to provide a sense of accomplishment and keep the project on track.
- Resource Allocation: Use the chart to visualize resource allocation and identify potential bottlenecks or over-allocation issues.
- Share and Collaborate: Share the Excel file with team members and encourage them to provide updates on their tasks. Consider using a shared online storage service to facilitate collaboration.
Limitations of Excel Gantt Charts
While Excel Gantt charts are useful, they have limitations compared to dedicated project management software:
- Limited Functionality: Excel lacks some of the advanced features of project management software, such as automated resource leveling, critical path analysis, and risk management tools.
- Scalability: Excel Gantt charts can become cumbersome to manage for large and complex projects with numerous tasks and dependencies.
- Collaboration Challenges: While Excel files can be shared, real-time collaboration and version control can be challenging.
- Reporting Capabilities: Excel’s reporting capabilities are limited compared to dedicated project management software.
Conclusion
An Excel Gantt chart template is a powerful and accessible tool for time management and project planning, particularly for individuals and small teams. Its ease of use, customization options, and cost-effectiveness make it a valuable asset for visualizing project timelines, tracking progress, and ensuring timely completion of tasks. While it may not be suitable for extremely complex projects, an Excel Gantt chart provides a solid foundation for effective project management and improved productivity.
 1024×768 gantt chart excel template db excelcom from db-excel.com
 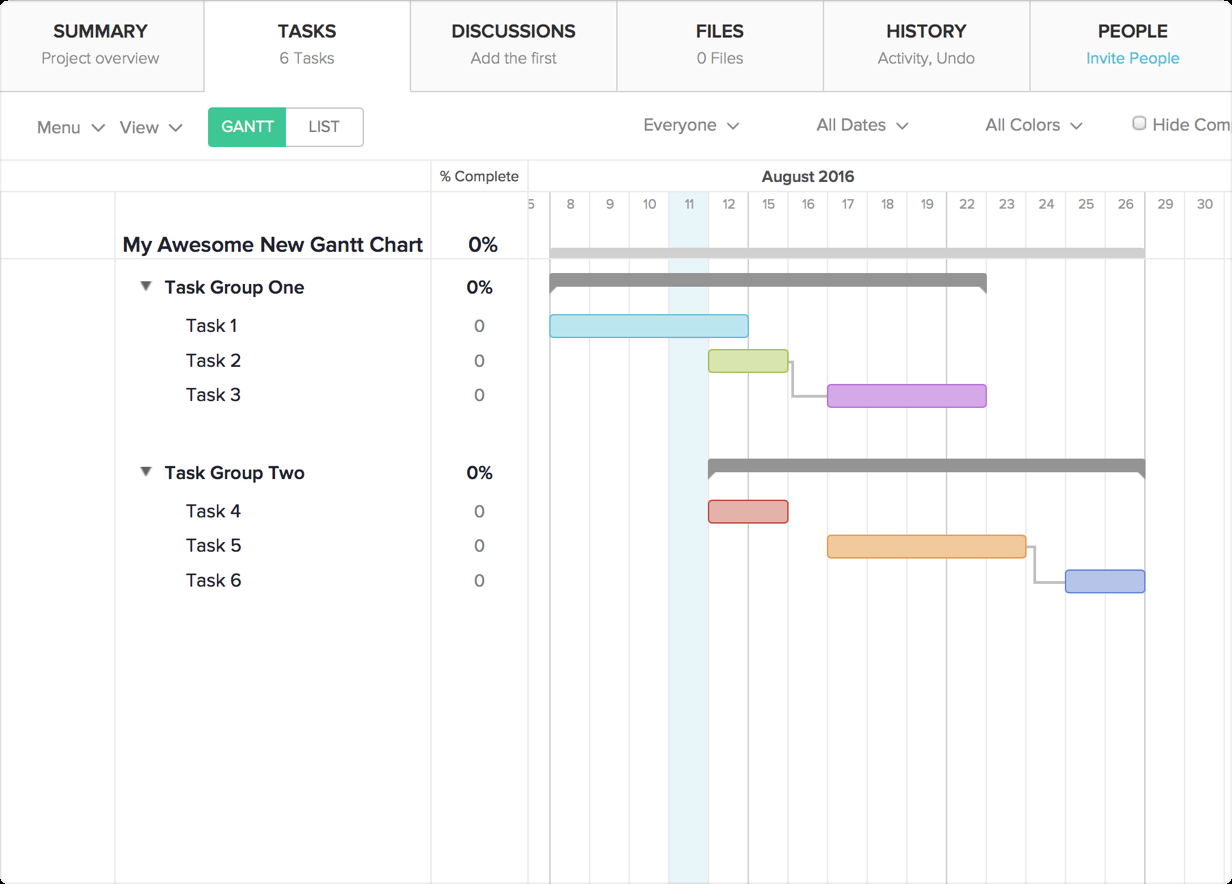 1232×884 gantt chart excel template teamgantt gantt from db-excel.com
  1024×1024 excel gantt chart flexible project spreadsheet luxtemplates from luxtemplates.com
  0 x 0 gantt chart excel template teamgantt from www.teamgantt.com
  1334×620 gantt chart excel template gantt excel from ganttxl.com
  601×376 time management template excel excelxocom from excelxo.com
  1729×1235 project management excel gantt chart template excel templates from www.exceltemplate123.us
  1024×791 time management schedule template db excelcom from db-excel.com
  1353×970 time management excel template db excelcom from db-excel.com
  1299×842 time management excel template time management log template from www.heritagechristiancollege.com
 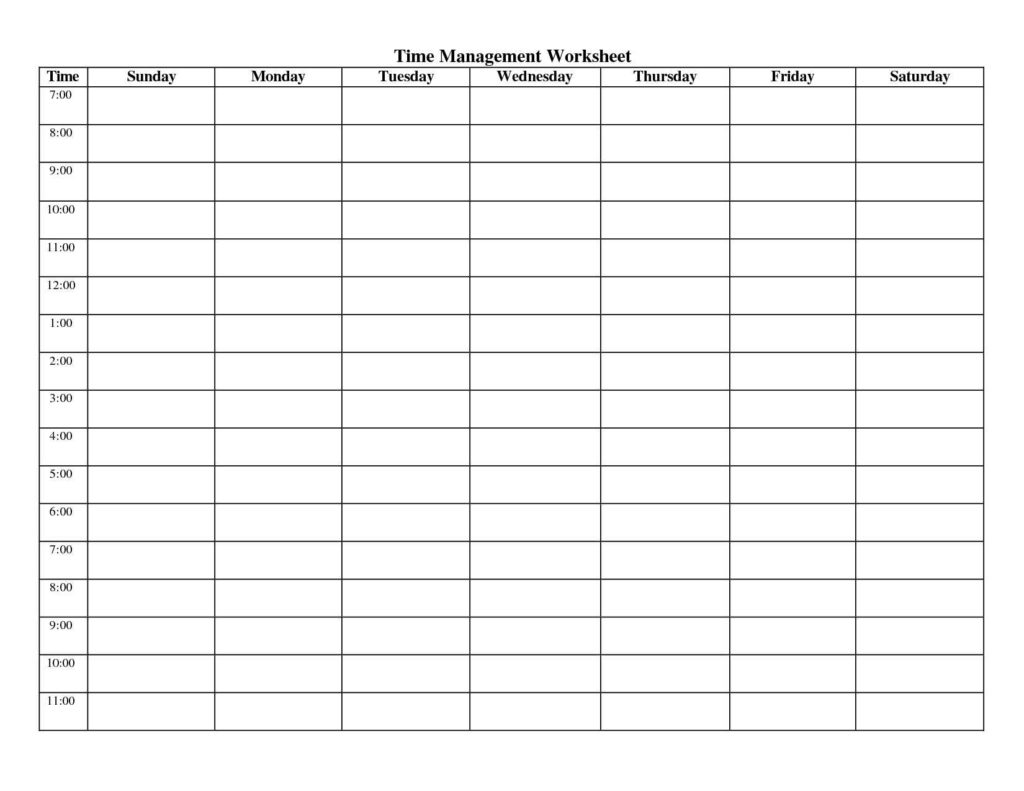 1024×791 project time management template db excelcom from db-excel.com
  900×1165 time management excel template time management excel template from www.heritagechristiancollege.com
  1280×577 gantt excel timeline ganttxl from ganttxl.com
  1650×1275 time management excel template time management schedule from www.heritagechristiancollege.com
  1920×1484 excel business templates exceltemplatenet from exceltemplate.net
 Thank you for visiting Time Management Gantt Template Excel. There are a lot of beautiful templates out there, but it can be easy to feel like a lot of the best cost a ridiculous amount of money, require special design. And if at this time you are looking for information and ideas regarding the Time Management Gantt Template Excel then, you are in the perfect place. Get this Time Management Gantt Template Excel for free here. We hope this post Time Management Gantt Template Excel inspired you and help you what you are looking for.
Time Management Gantt Template Excel was posted in February 16, 2026 at 6:17 pm. If you wanna have it as yours, please click the Pictures and you will go to click right mouse then Save Image As and Click Save and download the Time Management Gantt Template Excel Picture.. Don’t forget to share this picture with others via Facebook, Twitter, Pinterest or other social medias! we do hope you'll get inspired by SampleTemplates123... Thanks again! If you have any DMCA issues on this post, please contact us!