Excel Gantt Chart Template For Construction
Excel Gantt Chart Template for Construction: A Comprehensive Guide
Construction projects are inherently complex, involving numerous tasks, resources, and timelines that must be meticulously managed. An Excel Gantt chart template provides a powerful and accessible solution for visualizing project schedules, tracking progress, and ensuring timely completion. This guide will delve into the benefits of using an Excel Gantt chart for construction projects, explain how to create and customize one, and offer best practices for effective implementation.
Why Use an Excel Gantt Chart for Construction?
While dedicated project management software offers advanced features, Excel remains a popular choice for smaller to medium-sized construction projects due to its familiarity, accessibility, and cost-effectiveness. Here’s why an Excel Gantt chart is beneficial:
- Visual Clarity: A Gantt chart visually represents the project timeline, tasks, and dependencies, making it easy to understand the overall project scope and schedule at a glance.
- Task Management: Each task is clearly defined with its start and end dates, duration, and assigned resources, facilitating effective task allocation and tracking.
- Dependency Tracking: The chart visually highlights dependencies between tasks, ensuring that preceding tasks are completed before subsequent tasks can begin, preventing bottlenecks and delays.
- Progress Monitoring: As tasks are completed, the Gantt chart can be updated to reflect the actual progress, allowing for real-time monitoring and identification of potential deviations from the planned schedule.
- Resource Allocation: The chart allows you to allocate resources (e.g., personnel, equipment) to specific tasks, ensuring efficient resource utilization and preventing over-allocation.
- Communication & Collaboration: The Gantt chart serves as a central communication tool, keeping all stakeholders informed about the project’s progress and potential issues. It provides a shared understanding of responsibilities and timelines.
- Cost-Effective: Excel is widely available, eliminating the need for expensive project management software, making it a cost-effective solution for smaller construction businesses or projects with limited budgets.
Creating a Construction Gantt Chart in Excel: Step-by-Step
You can either create a Gantt chart from scratch in Excel or utilize a pre-built template. Both options have their advantages. Creating from scratch allows for full customization, while a template provides a ready-to-use structure that can be adapted to your specific needs.
Creating from Scratch:
- Data Entry: In separate columns, enter the following information for each task:
- Task Name
- Start Date
- Duration (in days)
- End Date (calculated from Start Date + Duration)
- Percentage Complete
- Assigned Resource (optional)
- Predecessor Task(s) (optional)
- Formatting the Chart Area:
- Select the date range for your project timeline.
- Choose a suitable cell size for representing days or weeks.
- Format the cells representing working days (exclude weekends and holidays). This can be achieved with conditional formatting and formulas.
- Adding the Gantt Bars:
- Use conditional formatting with formulas to create the Gantt bars. The formula will check if a date falls within the start and end date of a task. If it does, the cell will be formatted with a color to represent the task.
- For example, the conditional formatting formula might be something like: `=AND(COLUMN(A1)>=MATCH($B2,Sheet1!$1:$1,0),COLUMN(A1)<=MATCH($D2,Sheet1!$1:$1,0))` where B2 is the Start Date, D2 is the End Date, and the row 1 contains the dates across the timeline.
- Visual Enhancements:
- Add colors to differentiate tasks or phases.
- Use data bars to represent the “Percentage Complete” for each task.
- Add connecting lines to visually represent dependencies between tasks. (This typically requires drawing shapes in Excel).
Using a Pre-built Template:
- Download a Template: Search online for “Excel Gantt Chart Template for Construction.” Many free and premium templates are available. Choose one that best suits your needs.
- Data Entry: Replace the placeholder data in the template with your project-specific task information (Task Name, Start Date, Duration, etc.).
- Customization:
- Adjust the date range of the timeline to match your project duration.
- Modify the colors and formatting to align with your branding.
- Add or remove columns as needed (e.g., Resource Allocation, Predecessor Tasks).
- Adjust the conditional formatting rules to ensure the Gantt bars are displayed correctly.
Best Practices for Effective Gantt Chart Implementation
To maximize the benefits of your Excel Gantt chart, follow these best practices:
- Regular Updates: Keep the Gantt chart updated regularly with the actual progress of each task. This allows for timely identification of potential delays and proactive adjustments to the schedule.
- Clear Task Definitions: Ensure that each task is clearly defined and has a realistic duration. Break down large tasks into smaller, more manageable sub-tasks.
- Dependency Management: Accurately identify and represent dependencies between tasks. This prevents tasks from starting prematurely and potentially delaying subsequent tasks.
- Resource Allocation: Allocate resources effectively to ensure that each task has the necessary resources for timely completion. Avoid over-allocation, which can lead to resource conflicts.
- Communication & Collaboration: Share the Gantt chart with all stakeholders and encourage regular communication and feedback. This fosters a collaborative environment and ensures that everyone is aligned on the project goals and timelines.
- Backup and Version Control: Regularly back up your Excel file and implement version control to prevent data loss and ensure that you can revert to previous versions if needed.
- Consider Cloud-Based Options: If collaboration is critical, consider saving the Excel file to a cloud-based platform like OneDrive or Google Sheets, which allows for real-time collaboration and version control.
Conclusion
An Excel Gantt chart template provides a valuable tool for managing construction projects effectively. By visualizing the project schedule, tracking progress, and managing dependencies, it helps ensure timely completion and efficient resource utilization. Whether you create a chart from scratch or utilize a pre-built template, remember to update it regularly, communicate effectively, and follow best practices to maximize its benefits. While more advanced project management software offers sophisticated features, Excel offers a readily available and cost-effective solution for many construction projects.
 1577×636 construction gantt chart excel template gantt excel from www.ganttexcel.com
 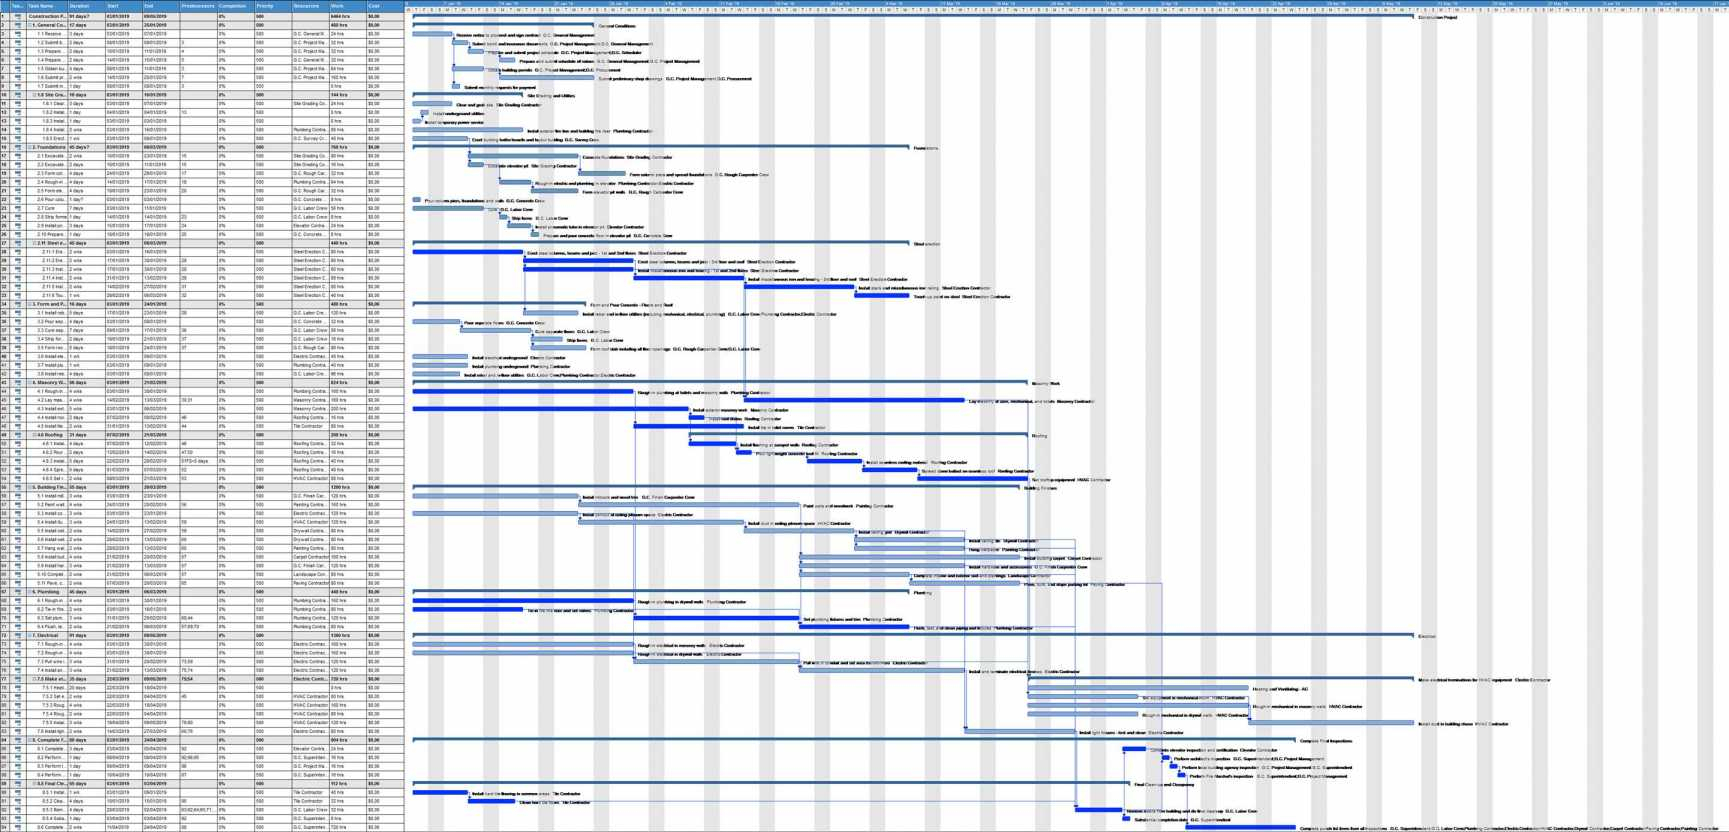 1729×832 excel templates construction project management worksheet from db-excel.com
 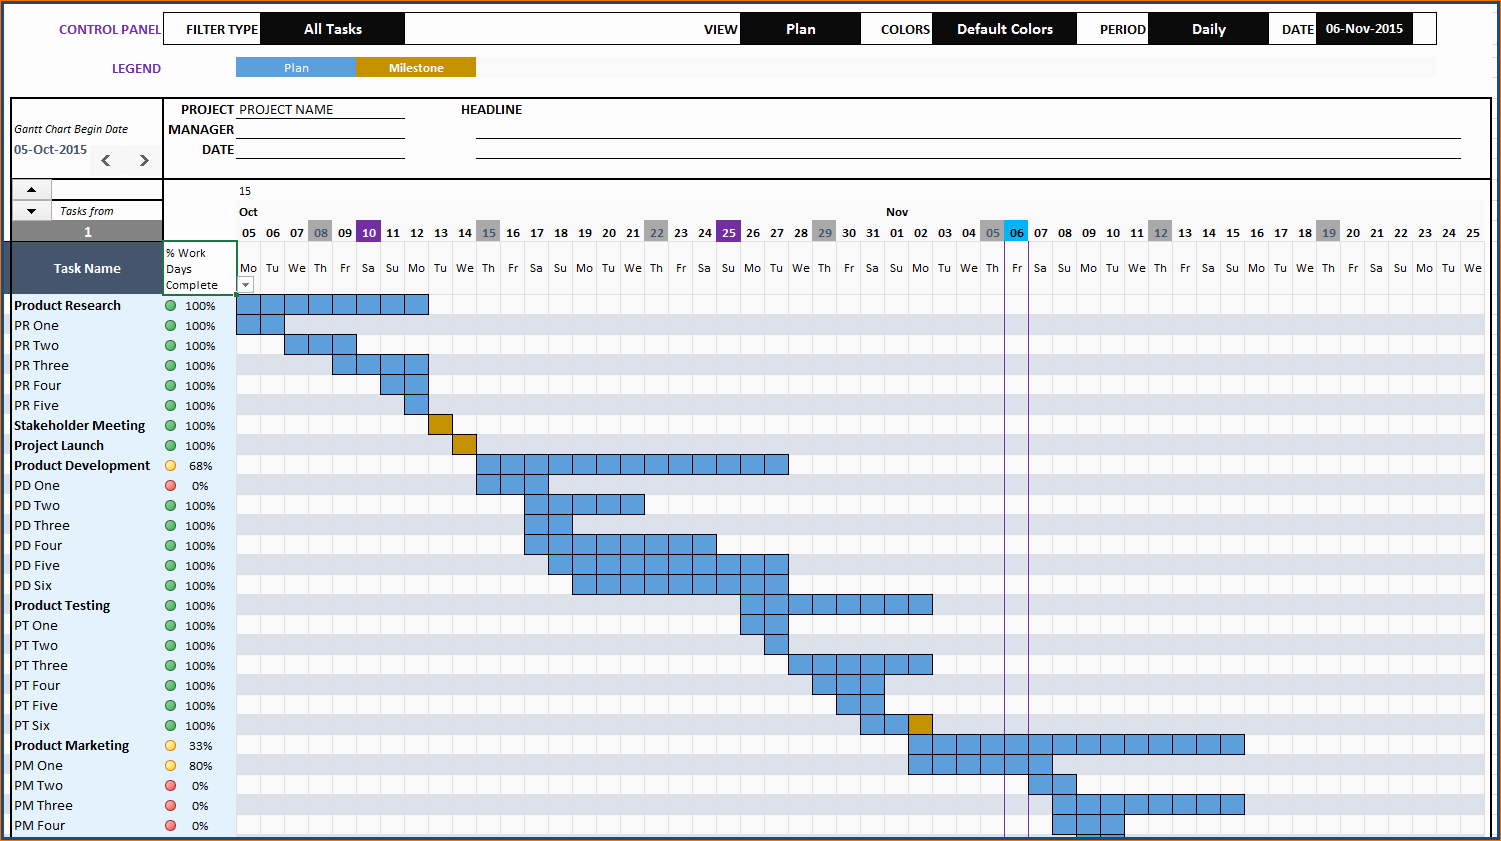 1501×841 construction gantt chart excel template from shootersjournal.net
  1232×884 construction gantt chart excel template printable receipt template from www.printablereceipttemplate.com
 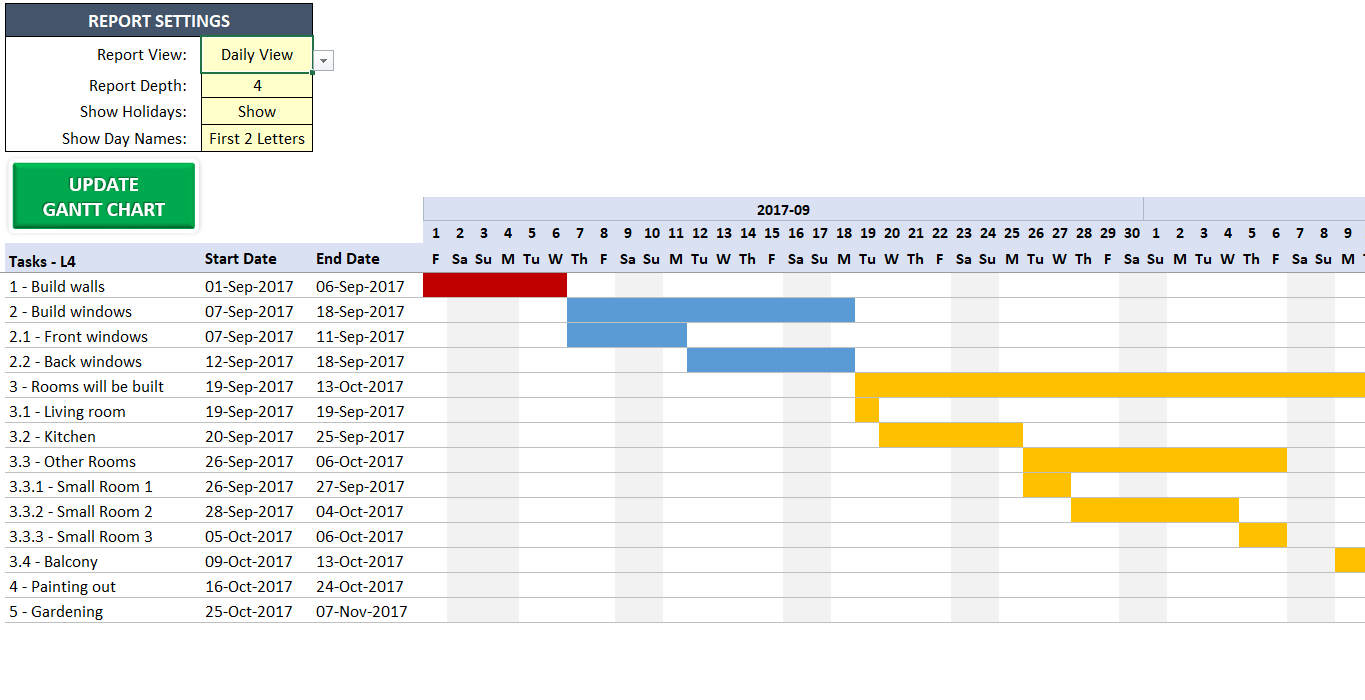 1365×700 gantt chart construction template excel db excelcom from db-excel.com
 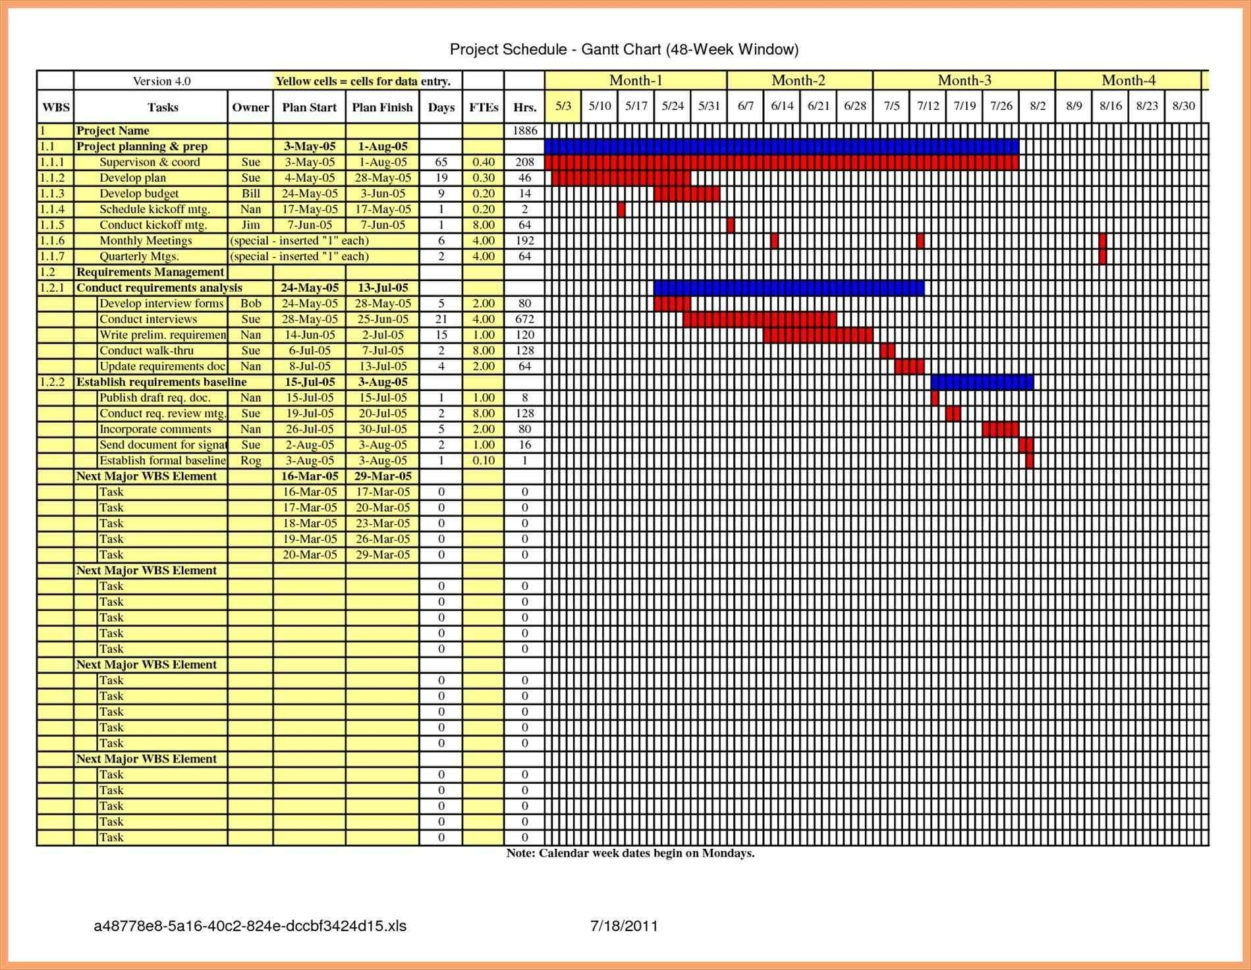 1251×970 gantt chart construction template excel spreadshee gantt from db-excel.com
 Thank you for visiting Excel Gantt Chart Template For Construction. There are a lot of beautiful templates out there, but it can be easy to feel like a lot of the best cost a ridiculous amount of money, require special design. And if at this time you are looking for information and ideas regarding the Excel Gantt Chart Template For Construction then, you are in the perfect place. Get this Excel Gantt Chart Template For Construction for free here. We hope this post Excel Gantt Chart Template For Construction inspired you and help you what you are looking for.
Excel Gantt Chart Template For Construction was posted in June 30, 2025 at 5:39 pm. If you wanna have it as yours, please click the Pictures and you will go to click right mouse then Save Image As and Click Save and download the Excel Gantt Chart Template For Construction Picture.. Don’t forget to share this picture with others via Facebook, Twitter, Pinterest or other social medias! we do hope you'll get inspired by SampleTemplates123... Thanks again! If you have any DMCA issues on this post, please contact us!