Excel Gantt Chart Template For Research
Why Use an Excel Gantt Chart for Research?
Using an Excel Gantt chart offers several advantages for managing research projects:
- Visual Clarity: Gantt charts provide a clear visual representation of the project timeline, making it easy to understand the sequence of tasks, their durations, and dependencies. This visual clarity facilitates better planning and communication among team members.
- Task Management: It helps break down complex research projects into smaller, manageable tasks. Each task can be assigned a start date, end date, duration, and responsible party, promoting accountability.
- Dependency Tracking: Research tasks are often interdependent. A Gantt chart allows you to visually represent these dependencies, ensuring that tasks are completed in the correct order. This is crucial for avoiding delays caused by waiting for prerequisite tasks to finish.
- Progress Monitoring: Gantt charts allow you to track the progress of each task and the overall project. You can easily update the chart to reflect completed tasks, tasks in progress, and any delays. This enables proactive identification and resolution of potential issues.
- Resource Allocation: By visualizing the tasks and their timelines, you can better allocate resources (personnel, equipment, budget) to different stages of the research project.
- Collaboration: Excel Gantt charts can be easily shared with team members, facilitating collaboration and communication. Everyone has access to the same information, ensuring that everyone is on the same page.
- Cost-Effective: Excel is readily available and requires no specialized software purchases. Using an Excel Gantt chart template is a cost-effective solution for project management, especially for smaller research teams or individual researchers.
Key Elements of an Excel Gantt Chart Template for Research
A comprehensive Excel Gantt chart template for research should include the following elements:
- Task List: A detailed list of all tasks required to complete the research project. Tasks should be broken down into smaller, manageable units.
- Start Date: The date on which each task is scheduled to begin.
- End Date: The date on which each task is scheduled to be completed.
- Duration: The estimated time required to complete each task (in days, weeks, or months).
- Dependencies: Identification of any tasks that depend on the completion of other tasks. These dependencies should be clearly indicated using arrows or other visual cues.
- Assigned To: The name of the person responsible for completing each task.
- Progress: A percentage or visual indicator showing the completion status of each task.
- Status: An indicator of the current status of each task (e.g., “Not Started,” “In Progress,” “Completed,” “Delayed”).
- Notes/Comments: A space to add notes or comments about each task, such as specific instructions, challenges encountered, or changes to the timeline.
- Gantt Chart Visual: The visual representation of the project timeline, with bars representing the duration of each task. The Gantt chart should clearly show the start and end dates of each task, as well as any dependencies.
Customizing Your Excel Gantt Chart Template
Excel offers several features to customize your Gantt chart template:
- Conditional Formatting: Use conditional formatting to automatically highlight tasks based on their status, progress, or due date. For example, you can highlight overdue tasks in red or tasks nearing completion in green.
- Color Coding: Use color coding to visually categorize tasks by type, phase, or responsible party. This can help you quickly identify tasks within specific categories.
- Data Validation: Use data validation to create drop-down lists for fields like “Status” or “Assigned To,” ensuring consistency and accuracy.
- Formulas: Use formulas to automatically calculate the duration of tasks based on their start and end dates. You can also use formulas to track overall project progress.
- Charts and Graphs: Incorporate additional charts and graphs to visualize project data, such as resource allocation or budget spending.
Best Practices for Using an Excel Gantt Chart for Research
To maximize the effectiveness of your Excel Gantt chart, follow these best practices:
- Start with a Clear Project Scope: Before creating your Gantt chart, define the scope of your research project clearly. This will help you identify all necessary tasks and dependencies.
- Break Down Tasks into Manageable Units: Avoid creating overly broad tasks. Break down large tasks into smaller, more manageable units. This will make it easier to track progress and identify potential issues.
- Estimate Task Durations Accurately: Take the time to estimate the duration of each task as accurately as possible. Consider potential challenges or delays that might occur.
- Regularly Update the Chart: Keep your Gantt chart up-to-date by regularly tracking progress and making adjustments as needed. This will ensure that the chart accurately reflects the current status of the project.
- Communicate Regularly with Your Team: Share the Gantt chart with your team members and encourage them to provide feedback and updates. This will foster collaboration and ensure that everyone is on the same page.
- Be Flexible: Research projects are often unpredictable. Be prepared to adjust your Gantt chart as needed to accommodate changes in the project scope, timeline, or resources.
By following these guidelines, you can effectively utilize an Excel Gantt chart template to manage your research projects, improve collaboration, and ensure timely completion.
 1024×768 gantt chart excel template excel spreadsheet gantt chart template from db-excel.com
  2500×2350 good gantt chart excel gantt chart excel template from gantt-chart-excel.com
 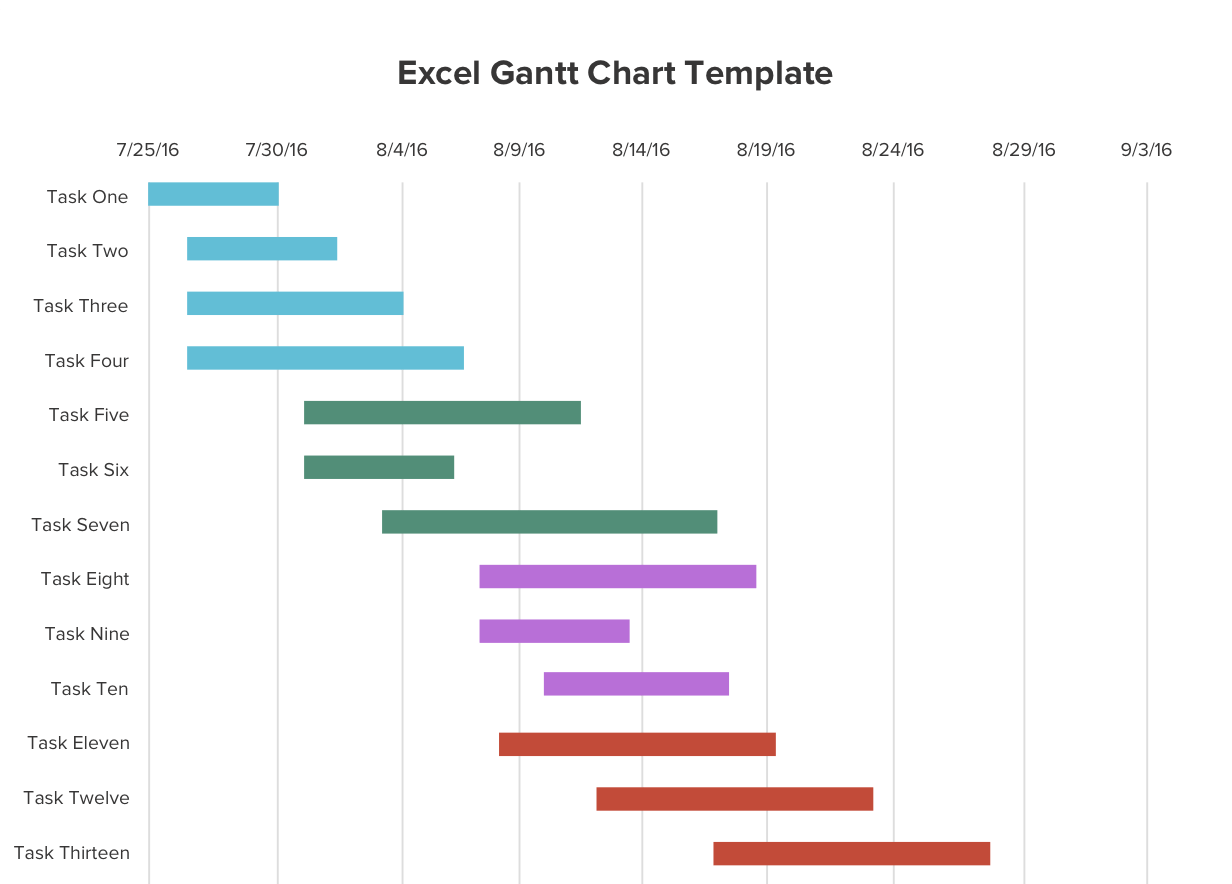 0 x 0 gantt chart excel template teamgantt from www.teamgantt.com
  1372×970 gantt chart template research proposal db excelcom from db-excel.com
 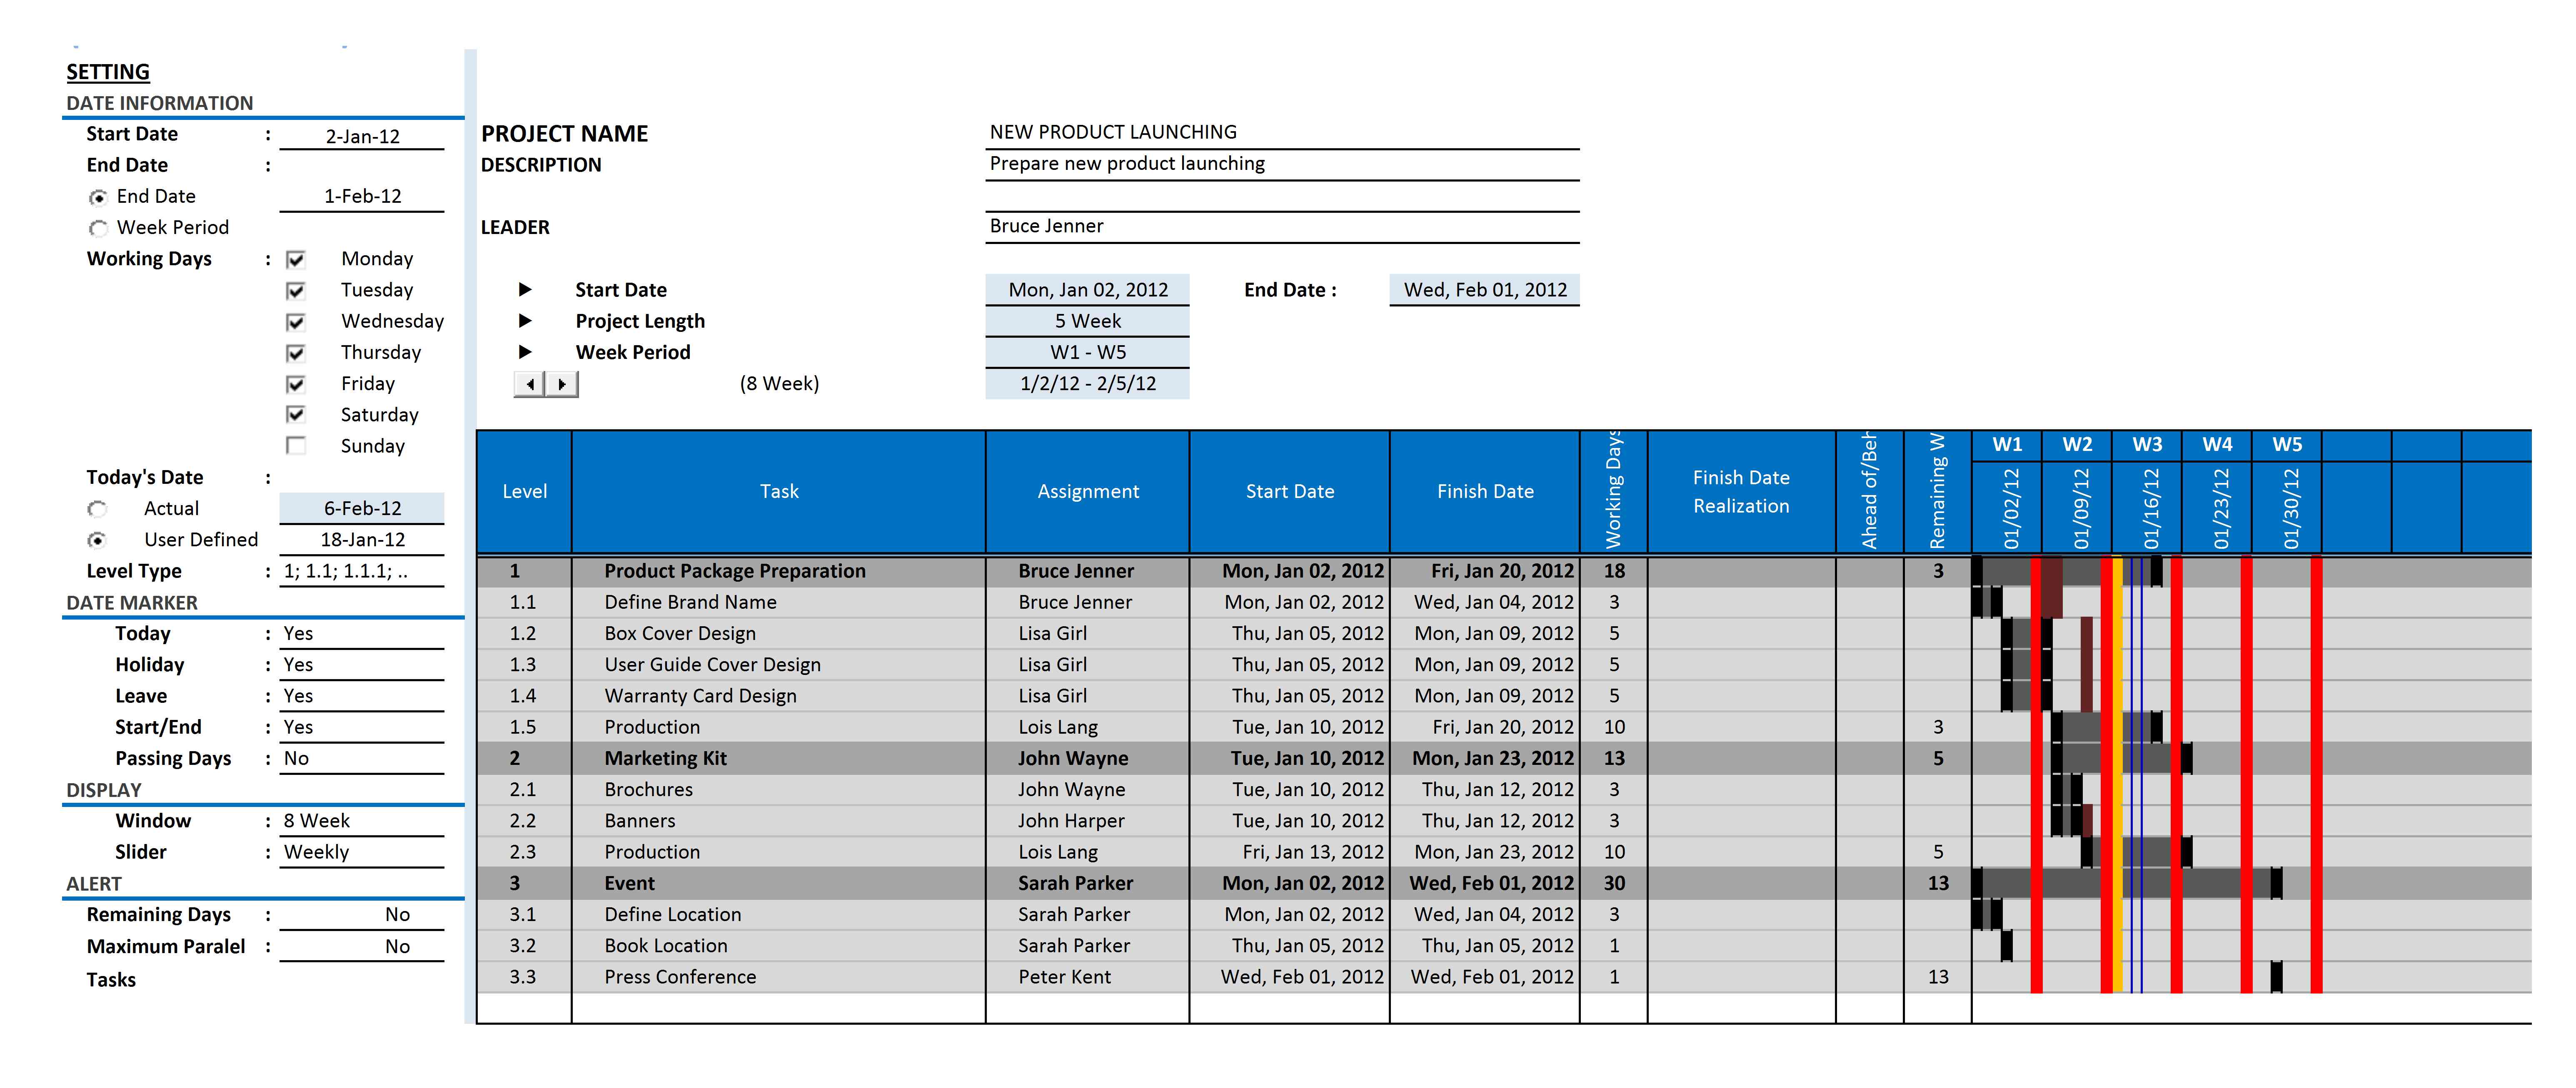 6184×2613 excel spreadsheet gantt chart template spreadsheet templates from excelxo.com
  1248×680 gantt chart template excel spreadshee gantt from db-excel.com
 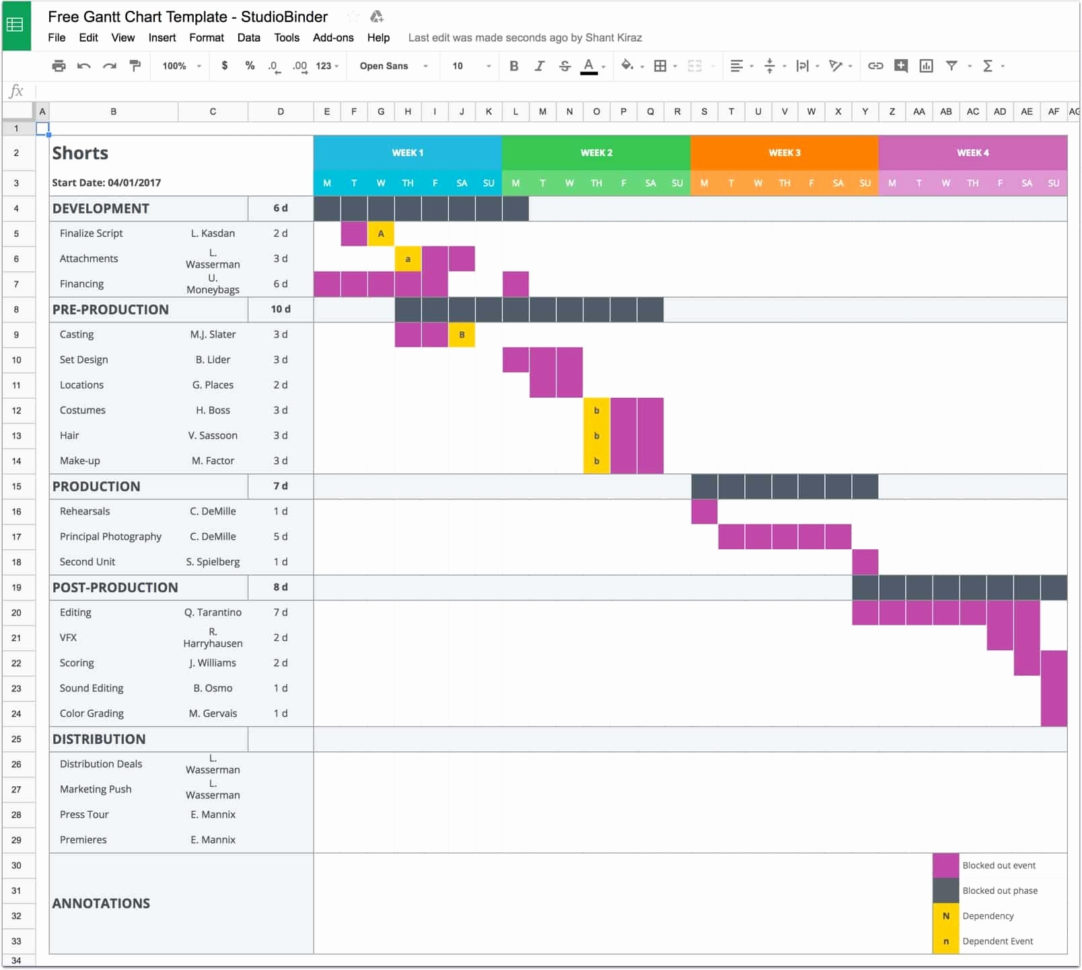 1082×970 gantt chart template excel spreadshee from db-excel.com
  1280×729 gantt chart template excel spreadshee from db-excel.com
  898×629 excel spreadsheets gantt chart template excel from excelspreadsheetshelp.blogspot.com
 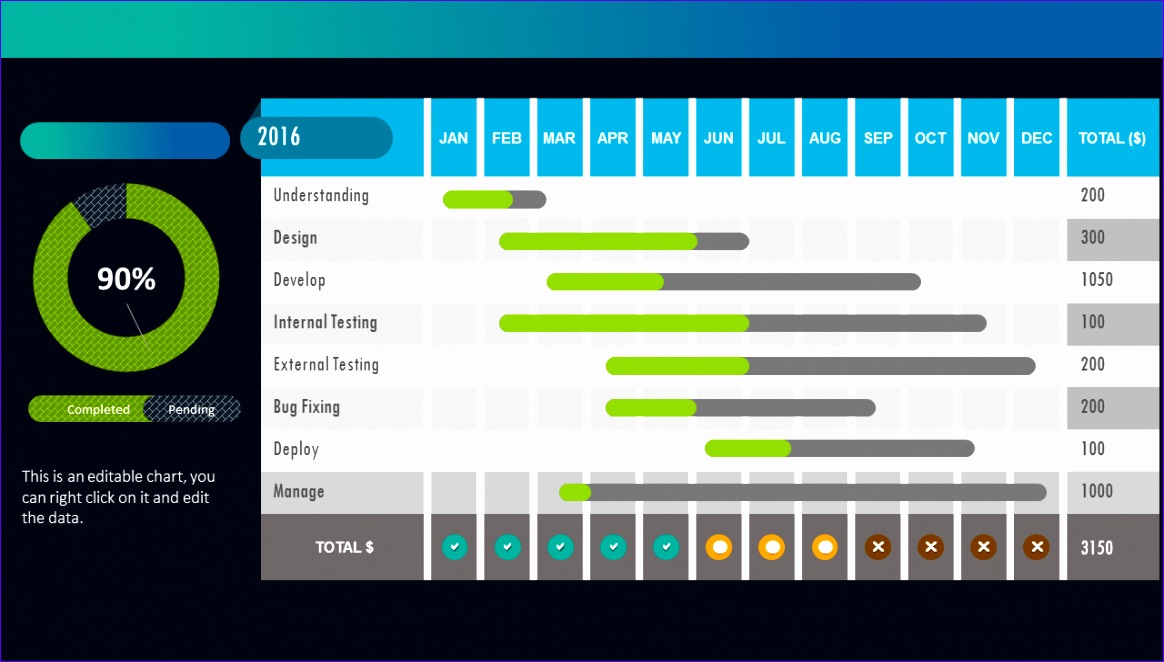 1164×662 gantt chart template excel excel templates from www.exceltemplate123.us
 Thank you for visiting Excel Gantt Chart Template For Research. There are a lot of beautiful templates out there, but it can be easy to feel like a lot of the best cost a ridiculous amount of money, require special design. And if at this time you are looking for information and ideas regarding the Excel Gantt Chart Template For Research then, you are in the perfect place. Get this Excel Gantt Chart Template For Research for free here. We hope this post Excel Gantt Chart Template For Research inspired you and help you what you are looking for.
Excel Gantt Chart Template For Research was posted in September 30, 2025 at 7:02 pm. If you wanna have it as yours, please click the Pictures and you will go to click right mouse then Save Image As and Click Save and download the Excel Gantt Chart Template For Research Picture.. Don’t forget to share this picture with others via Facebook, Twitter, Pinterest or other social medias! we do hope you'll get inspired by SampleTemplates123... Thanks again! If you have any DMCA issues on this post, please contact us!