Excel Gantt Chart Template Daily
Excel Gantt Chart Template for Daily Project Management
Effectively managing projects requires meticulous planning, tracking, and visualization. An Excel Gantt chart template can be an invaluable tool for achieving this, especially when you need to monitor tasks on a daily basis. This article delves into the benefits of using an Excel Gantt chart template for daily project management, exploring its functionalities and how to customize it to suit your specific needs.
Understanding the Basics of a Gantt Chart
A Gantt chart is a visual representation of a project timeline, breaking down tasks, their durations, start and end dates, and dependencies. It provides a clear overview of the project’s progress, allowing project managers and team members to stay informed and aligned. In its simplest form, a Gantt chart consists of a horizontal bar chart where the length of each bar represents the duration of a specific task. Using an Excel template simplifies the creation and maintenance of these charts.
Why Choose an Excel Gantt Chart Template?
While specialized project management software offers advanced features, Excel remains a readily accessible and cost-effective solution for many projects. Excel Gantt chart templates offer several advantages:
- Accessibility: Excel is widely available and familiar to most users.
- Cost-Effectiveness: No additional software purchase is required.
- Customization: Excel offers flexibility to tailor the template to specific project needs.
- Ease of Use: Basic Excel skills are sufficient to utilize and modify the template.
Key Elements of a Daily Excel Gantt Chart Template
A well-designed daily Gantt chart template should include the following key elements:
- Task List: A comprehensive list of all project tasks, broken down into manageable activities.
- Start and End Dates: Clear definition of the start and end dates for each task. Crucially, for a daily view, these should be defined with specific dates, not just weeks or months.
- Duration: The estimated time required to complete each task, expressed in days.
- Dependencies: Identification of any task dependencies, where one task must be completed before another can begin. This is vital for accurately reflecting the project workflow.
- Progress Tracking: A mechanism to track the progress of each task, typically expressed as a percentage completed.
- Resource Allocation: Assignment of responsible individuals or teams to each task.
- Gantt Chart Visualization: A visual representation of the timeline, with bars indicating the duration of each task along a daily scale.
Customizing Your Excel Gantt Chart for Daily Monitoring
To optimize your Excel Gantt chart for daily monitoring, consider the following customizations:
- Daily Time Scale: Ensure the horizontal axis of your chart displays a daily time scale. This allows for precise tracking of task progress on a day-to-day basis. You might need to adjust the date formatting in Excel to display dates clearly.
- Conditional Formatting: Utilize conditional formatting to highlight tasks based on their status. For example, highlight overdue tasks in red, completed tasks in green, and tasks due to start within the next few days in yellow. This provides immediate visual cues for potential issues.
- Progress Bars: Implement dynamic progress bars that visually reflect the percentage completion of each task. This allows for a quick assessment of overall project progress. Use Excel’s data bars feature within conditional formatting or custom formulas to achieve this.
- Highlighting Current Day: Use conditional formatting to automatically highlight the current day on the Gantt chart. This provides a clear reference point for tracking project progress.
- Task Dependencies: Visually represent task dependencies using arrows or lines on the Gantt chart. This helps to identify critical path tasks and potential bottlenecks. You may need to use Excel’s drawing tools for this.
- Resource Allocation Indicators: Incorporate indicators to show resource allocation for each task. This could involve adding a column for assigned personnel or using color-coding to represent different teams.
- Daily Updates Column: Add a dedicated column to record daily updates or notes for each task. This allows for detailed tracking of progress and any challenges encountered.
Formulas and Functions for Automation
Leverage Excel’s formulas and functions to automate various aspects of your Gantt chart:
- Calculating Duration: Use the formula `=End Date – Start Date + 1` to automatically calculate the duration of each task.
- Conditional Formatting Based on Dates: Employ formulas like `=AND(TODAY()>=Start Date, TODAY()<=End Date)` to highlight tasks that are currently in progress.
- Progress Tracking: Use formulas to calculate the remaining duration based on the percentage completed. For example, `=(1-Progress)*Duration`.
- Automated Task Scheduling: Utilize formulas with `IF` statements to automatically adjust the start date of a task based on the completion of its predecessor, ensuring that dependencies are maintained.
Benefits of Daily Project Management with an Excel Gantt Chart
Using an Excel Gantt chart template for daily project management offers several benefits:
- Improved Tracking: Daily monitoring allows for early identification of potential delays or issues.
- Enhanced Communication: The visual nature of the Gantt chart facilitates clear communication among team members and stakeholders.
- Increased Accountability: Clearly defined tasks and responsibilities promote accountability.
- Better Resource Allocation: Monitoring resource allocation on a daily basis allows for adjustments to optimize resource utilization.
- Proactive Problem Solving: Early detection of issues enables proactive problem-solving and mitigation of risks.
Conclusion
An Excel Gantt chart template, when customized for daily monitoring, provides a powerful and accessible tool for project management. By incorporating the elements and customizations discussed, you can effectively track progress, manage resources, and ensure timely completion of your projects. While specialized software offers more advanced features, Excel remains a viable and cost-effective option, particularly for smaller projects or teams with limited resources. Remember to regularly update your Gantt chart to maintain its accuracy and relevance throughout the project lifecycle.
 1024×768 gantt chart excel template db excelcom from db-excel.com
 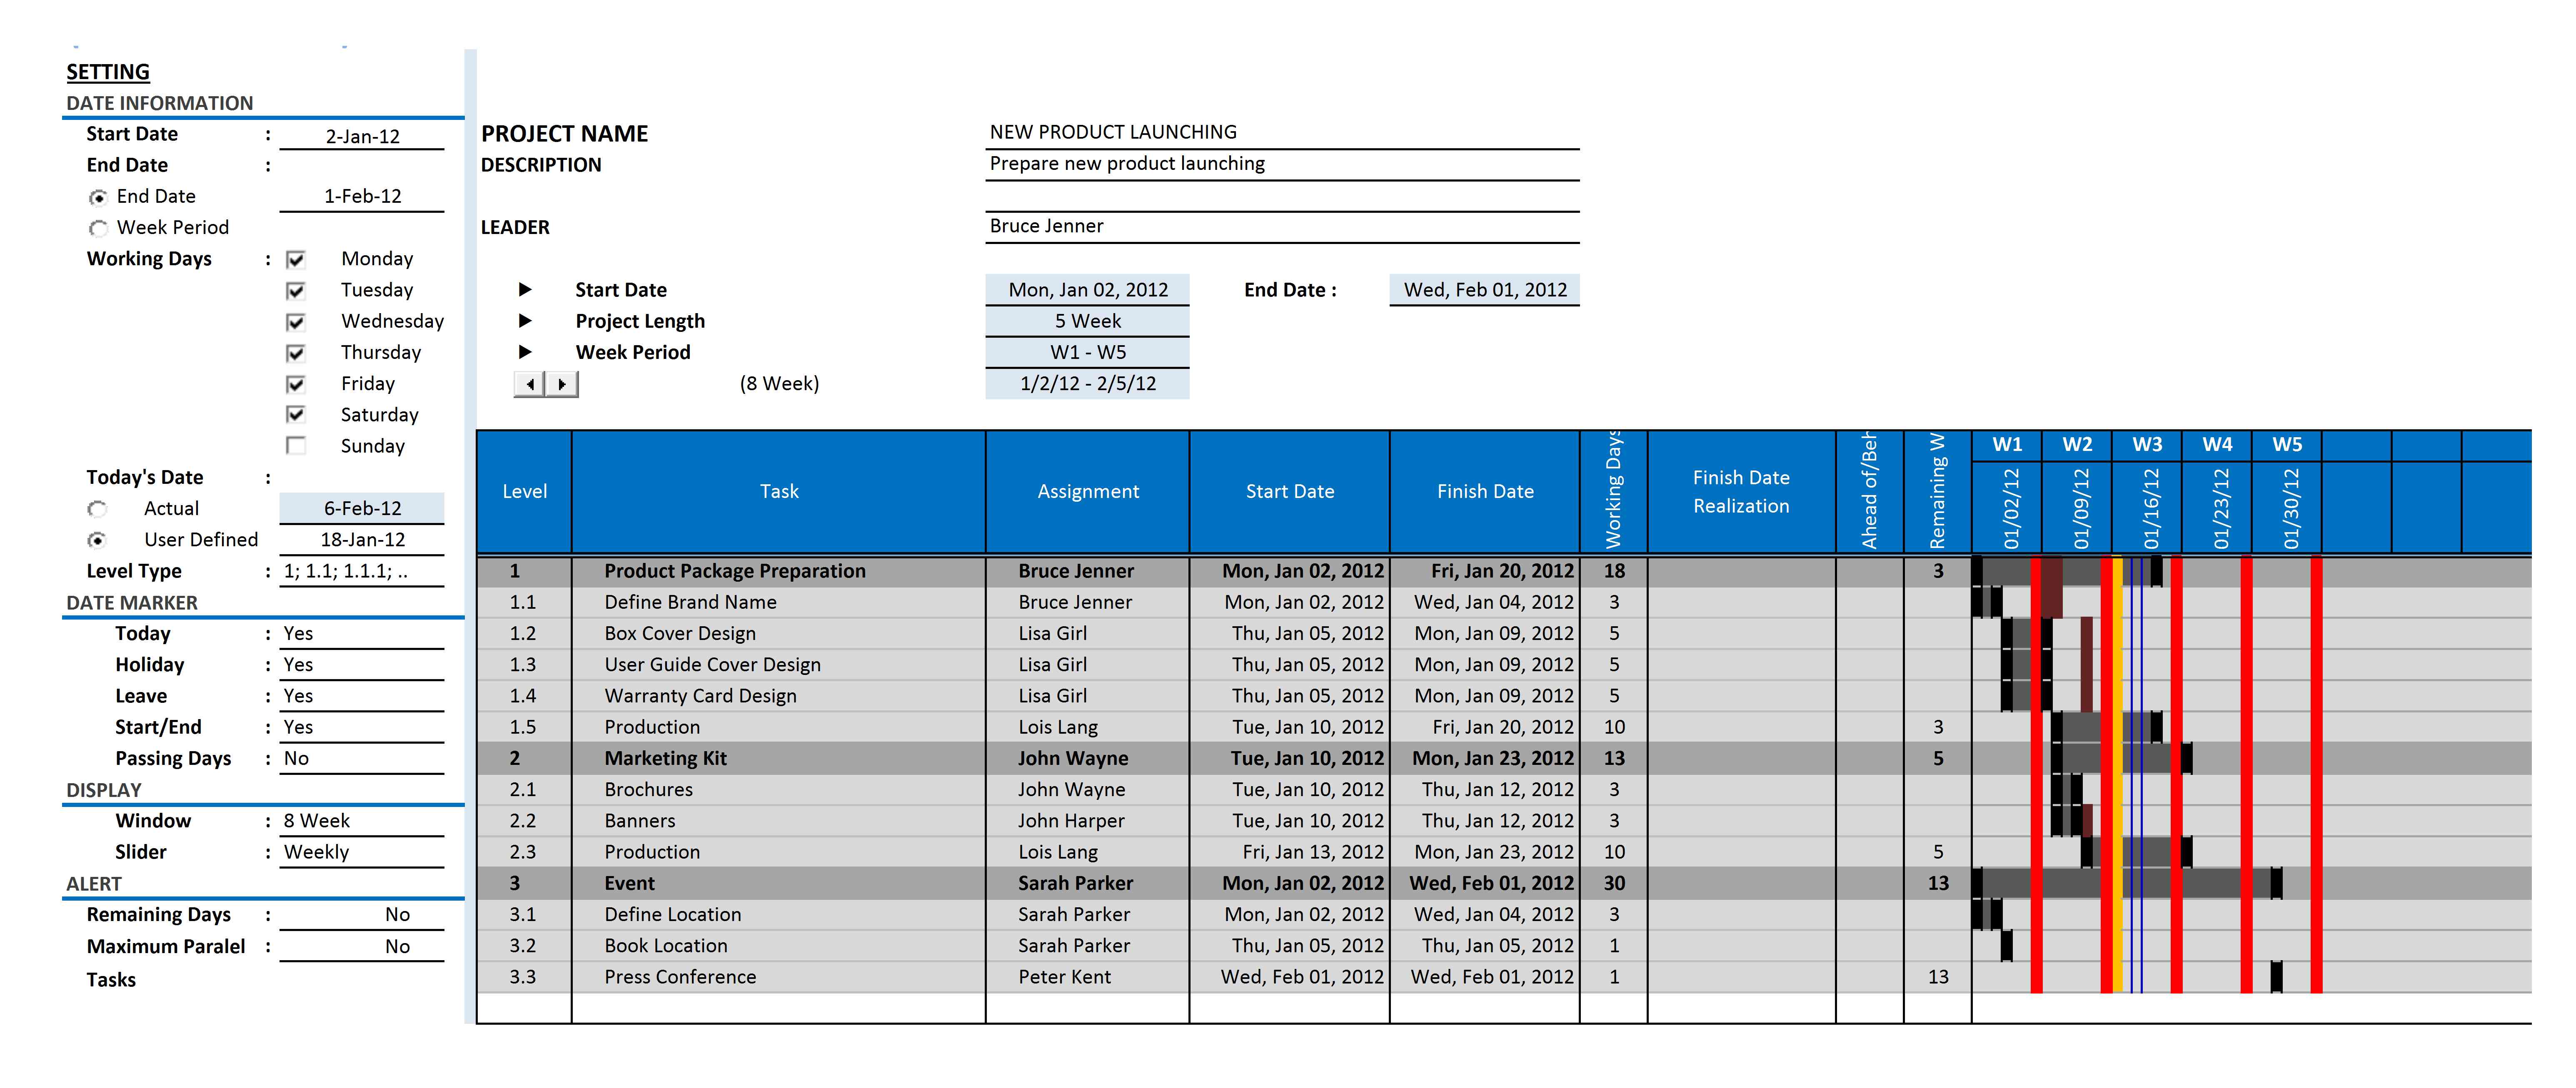 6184×2613 excel spreadsheet gantt chart template excelxocom from excelxo.com
  1273×758 gantt chart template excel monthly excel templates from exceltemplate77.blogspot.com
  0 x 0 gantt chart excel template teamgantt from www.teamgantt.com
  1056×816 gantt chart weekly based template templates gantt chart from db-excel.com
 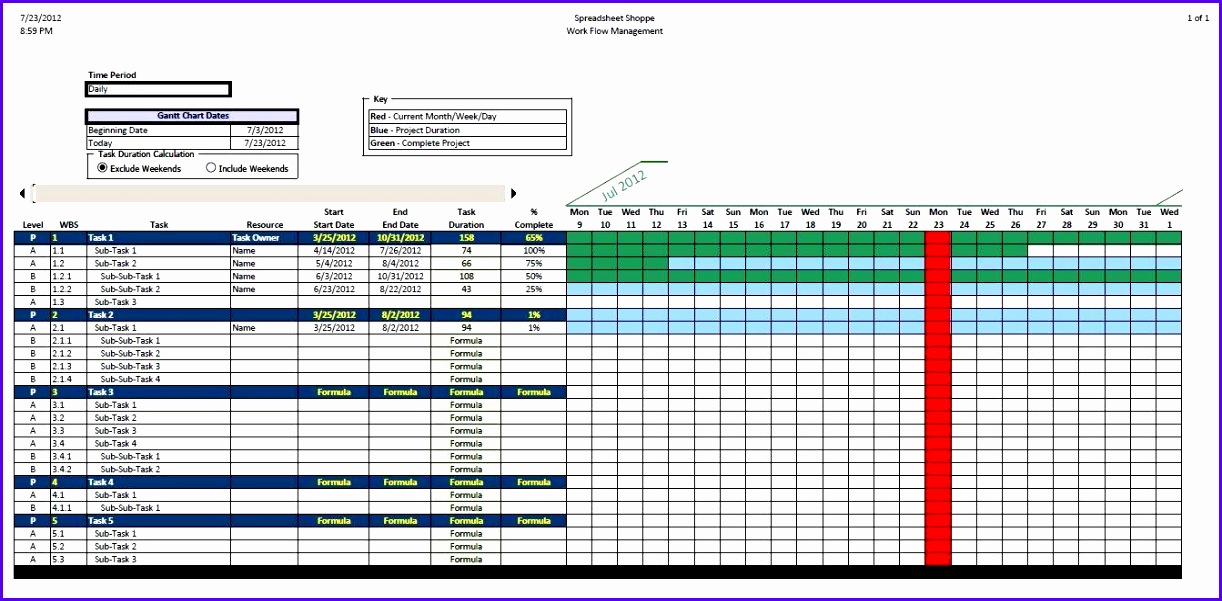 1222×601 daily gantt chart excel template excel templates from www.exceltemplate123.us
  820×656 daily gantt chart excel template excel templates excel templates from www.exceltemplate123.us
  1366×768 gantt chart excel excel templates from exceltemplate77.blogspot.com
  2382×1684 excel spreadsheet gantt chart template spreadsheet templates from db-excel.com
 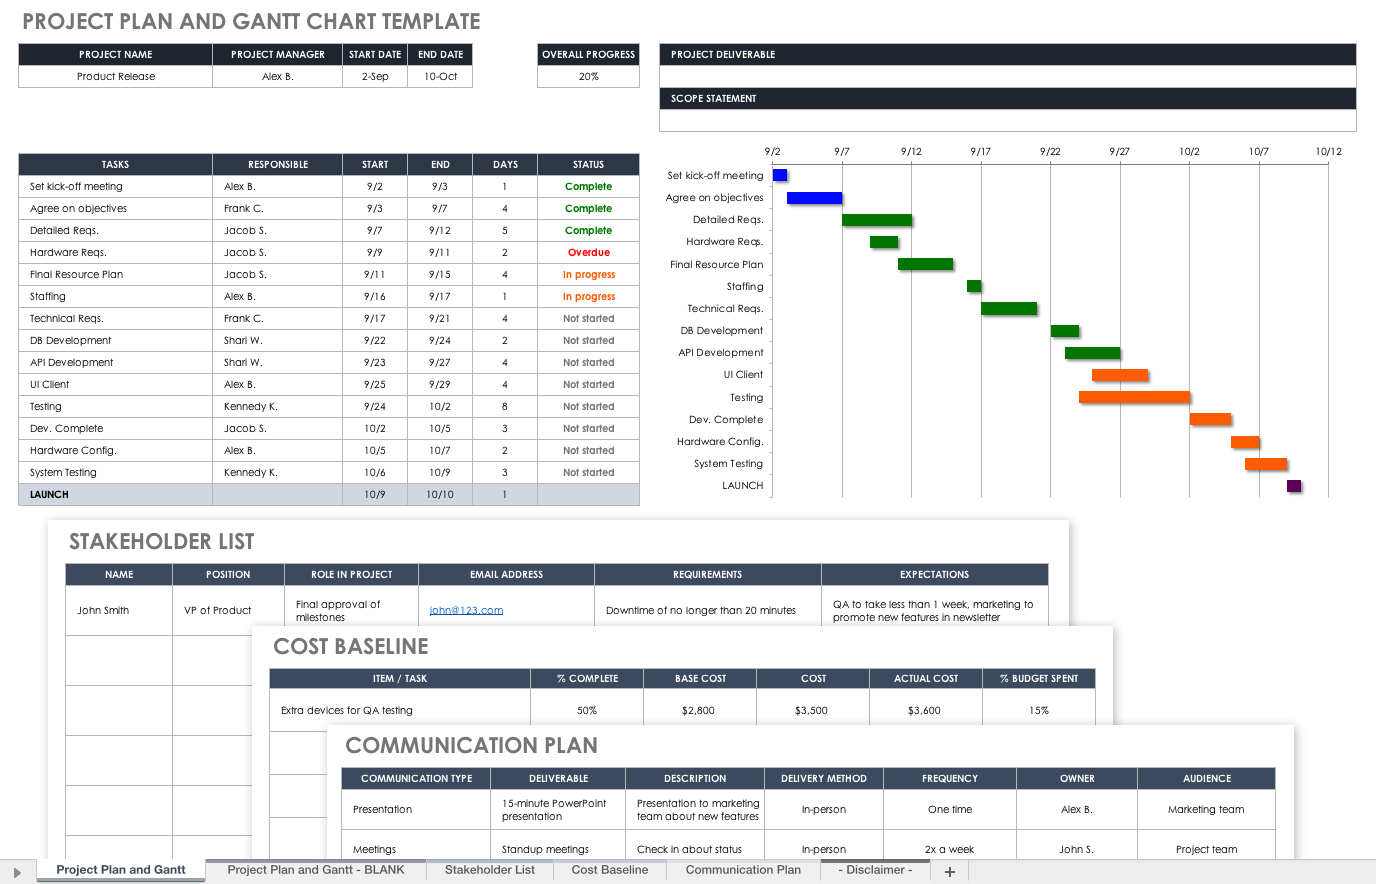 1376×884 gantt chart template excel spreadshee from db-excel.com
  1029×586 monthly gantt chart excel template from lesboucans.com
  1280×729 gantt chart template excel spreadshee from db-excel.com
 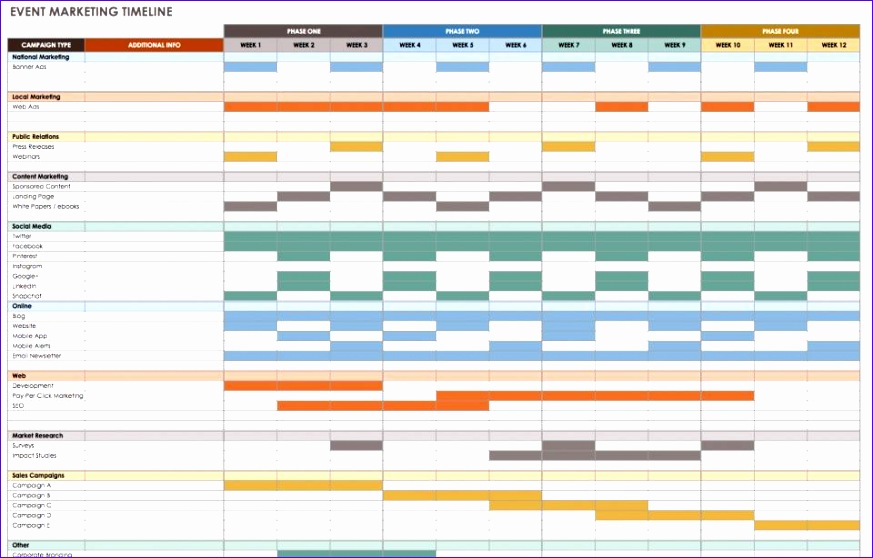 873×558 monthly gantt chart excel template excel templates from www.exceltemplate123.us
 Thank you for visiting Excel Gantt Chart Template Daily. There are a lot of beautiful templates out there, but it can be easy to feel like a lot of the best cost a ridiculous amount of money, require special design. And if at this time you are looking for information and ideas regarding the Excel Gantt Chart Template Daily then, you are in the perfect place. Get this Excel Gantt Chart Template Daily for free here. We hope this post Excel Gantt Chart Template Daily inspired you and help you what you are looking for.
Excel Gantt Chart Template Daily was posted in July 14, 2025 at 11:08 am. If you wanna have it as yours, please click the Pictures and you will go to click right mouse then Save Image As and Click Save and download the Excel Gantt Chart Template Daily Picture.. Don’t forget to share this picture with others via Facebook, Twitter, Pinterest or other social medias! we do hope you'll get inspired by SampleTemplates123... Thanks again! If you have any DMCA issues on this post, please contact us!
Related For Excel Gantt Chart Template Daily
PowerPoint Gantt Chart Template Dai
PowerPoint Gantt Chart Template: Managing Projects Day by DayModern Gantt Chart Template For Stu
Modern Gantt Chart Template for Students Modern Gantt Chart