Google Sheets Gantt Chart Template With Timeline
Gantt charts are invaluable project management tools, providing a visual representation of project timelines, tasks, and dependencies. Google Sheets offers a versatile platform for creating Gantt charts, and utilizing pre-built templates streamlines the process. This guide will explore using Google Sheets Gantt chart templates with a specific focus on incorporating a dynamic timeline. The power of a Gantt chart lies in its ability to illustrate project scope at a glance. It clearly outlines: * **Tasks:** Individual activities required to complete the project. * **Start and End Dates:** Defining the duration of each task. * **Dependencies:** Relationships between tasks (e.g., Task B cannot start until Task A is finished). * **Progress:** Visual indication of task completion. * **Resources:** Allocation of personnel or equipment to specific tasks (optional, but useful). **Why Use a Google Sheets Gantt Chart Template?** Creating a Gantt chart from scratch in Google Sheets can be time-consuming. Templates offer several key advantages: * **Time Savings:** Pre-formatted spreadsheets with formulas and conditional formatting are ready to use. * **Ease of Use:** Even users with limited spreadsheet experience can quickly adapt and populate the template. * **Consistency:** Standardized formatting ensures clear communication and easy comparison between projects. * **Customization:** Templates are typically flexible enough to be tailored to specific project requirements. * **Accessibility:** Being cloud-based, Google Sheets allows for easy sharing and collaboration among team members. **Finding a Suitable Template** Google offers various Gantt chart templates directly within Google Sheets. To access them: 1. Open Google Sheets (sheets.google.com). 2. Click the “+” (Blank) icon to create a new spreadsheet. 3. Go to “File” > “New” > “From template gallery”. 4. Search for “Gantt chart”. Alternatively, search online for “Google Sheets Gantt Chart Template”. Many third-party providers offer free and premium templates with varying features. When choosing a template, consider: * **Complexity:** Does it offer the level of detail needed for your project (e.g., dependency tracking, resource allocation)? * **Customization Options:** Can you easily modify colors, labels, and formatting? * **Timeline Functionality:** Does it dynamically update the timeline based on changes to task dates? * **User Reviews:** If using a third-party template, check reviews to ensure its reliability and ease of use. **Key Elements of a Gantt Chart Template with Timeline** A well-designed Gantt chart template should include the following: * **Task List:** A column listing all project tasks. * **Start Date Column:** Where you input the starting date for each task. * **End Date Column:** Where you input the ending date for each task. * **Duration Column:** This column automatically calculates the duration of each task based on the start and end dates (usually using a formula like `=END_DATE – START_DATE`). * **Progress Column:** A column to track the percentage of task completion (e.g., 0%, 25%, 50%, 75%, 100%). This often utilizes data validation to restrict input to valid percentages. * **Dependencies Column (Optional):** A column to indicate which task(s) must be completed before a given task can begin. This is crucial for critical path analysis. * **Timeline Chart:** This is the visual heart of the Gantt chart. It displays each task as a bar along a horizontal timeline, representing its duration. This timeline should dynamically update based on the start and end dates entered in the corresponding columns. This dynamic updating is usually achieved through conditional formatting rules that highlight cells based on whether the date represented by the column falls within the task’s start and end dates. * **Project Start Date:** A single cell where you define the overall project start date. This serves as the reference point for the entire timeline. * **Formula-Driven Timeline:** The most effective Gantt chart templates use formulas to generate the timeline. These formulas typically involve calculating the number of days between the project start date and the task start date, and then applying conditional formatting to display the task bar. **Customizing and Using the Template** 1. **Populate the Task List:** Enter all the necessary tasks for your project in the “Task List” column. 2. **Enter Start and End Dates:** Specify the start and end dates for each task. The “Duration” column should automatically update. 3. **Update Progress:** As tasks are completed, update the “Progress” column accordingly. The timeline chart should visually reflect the progress. 4. **Define Dependencies (If applicable):** If your template includes a “Dependencies” column, specify the preceding task(s) for each task. Some advanced templates can automatically adjust task dates based on dependencies. 5. **Customize Formatting:** Modify colors, fonts, and other formatting elements to match your preferences or company branding. 6. **Add Resources (If applicable):** If your template allows for resource allocation, assign personnel or equipment to each task. 7. **Monitor and Update:** Regularly review and update the Gantt chart to reflect changes in project status, deadlines, or resources. **Tips for Effective Gantt Chart Use** * **Keep it Simple:** Avoid overcrowding the chart with too much detail. Focus on essential tasks and milestones. * **Be Realistic:** Ensure that task durations are realistic and achievable. * **Regularly Update:** Keep the chart current to provide an accurate representation of project progress. * **Communicate Effectively:** Use the Gantt chart as a communication tool to keep stakeholders informed about project timelines and progress. * **Use Conditional Formatting Wisely:** Leverage conditional formatting to highlight critical tasks, overdue deadlines, or tasks nearing completion. * **Explore Add-ons:** Consider using Google Sheets add-ons to enhance the functionality of your Gantt chart, such as automated dependency tracking or resource leveling. By utilizing a well-designed Google Sheets Gantt chart template with a dynamic timeline, you can effectively plan, manage, and track your projects, ensuring timely completion and clear communication among team members. The flexibility and collaborative nature of Google Sheets make it a powerful platform for project management, even for those without specialized project management software.
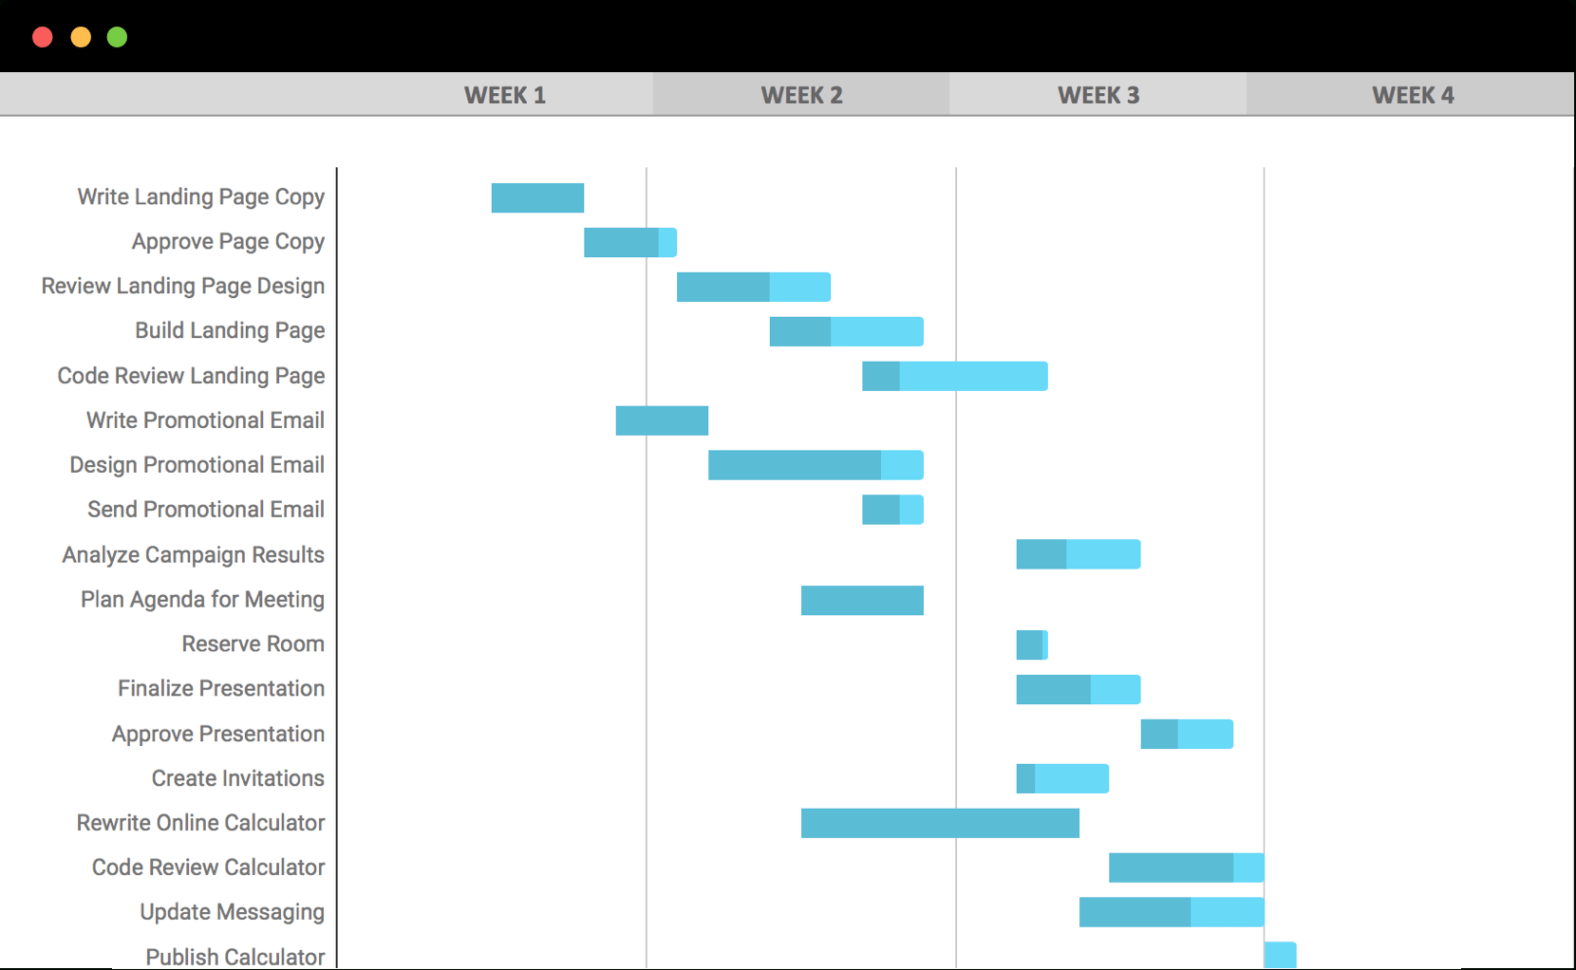 1576×970 google sheets gantt chart template teamgantt gantt from db-excel.com
  1170×658 gantt chart excel template google sheets compatible from spitmarket.com
  900×391 gantt chart google sheets template from www.officetimeline.com
  843×686 google sheets gantt chart template doctemplates from doctemplates.us
  1202×601 gantt chart google sheets template deeps from www.deepsonline.com
 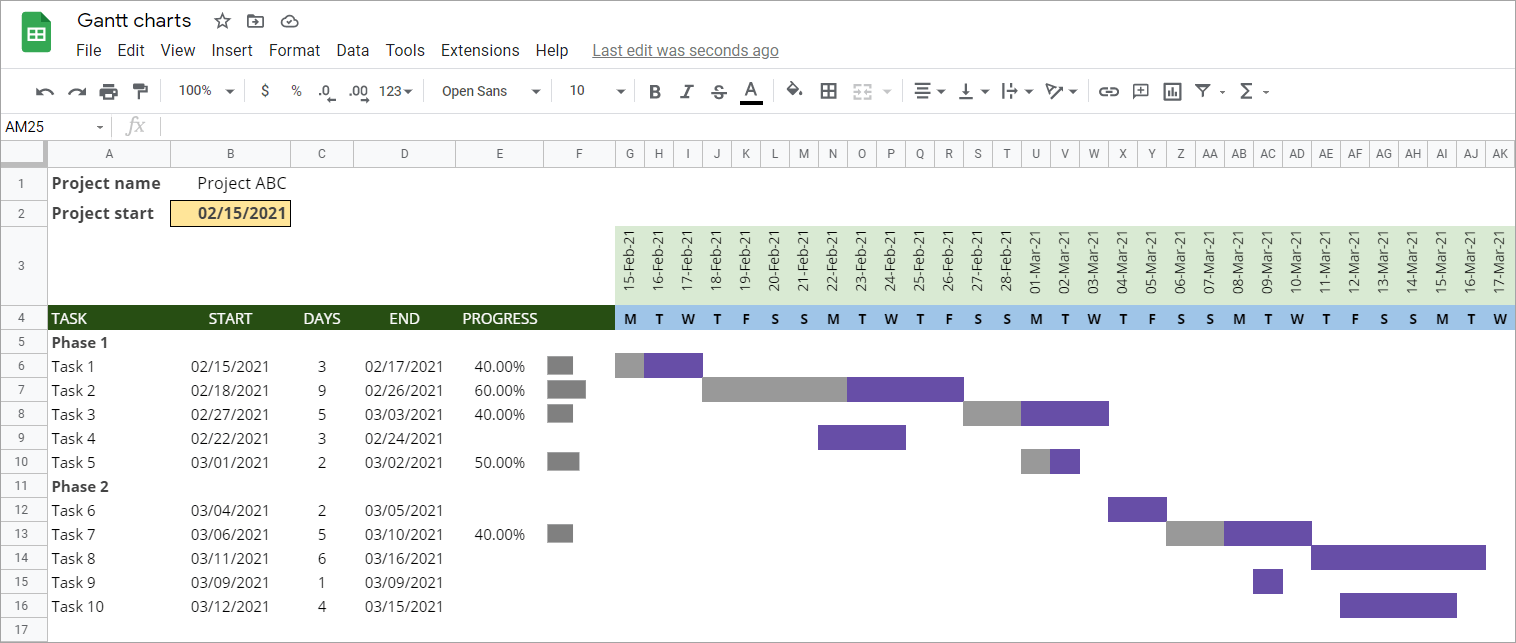 1516×643 create gantt charts google sheets couplerio blog from blog.coupler.io
  1786×1040 google sheet gantt chart template from instagantt.com
 Thank you for visiting Google Sheets Gantt Chart Template With Timeline. There are a lot of beautiful templates out there, but it can be easy to feel like a lot of the best cost a ridiculous amount of money, require special design. And if at this time you are looking for information and ideas regarding the Google Sheets Gantt Chart Template With Timeline then, you are in the perfect place. Get this Google Sheets Gantt Chart Template With Timeline for free here. We hope this post Google Sheets Gantt Chart Template With Timeline inspired you and help you what you are looking for.
Google Sheets Gantt Chart Template With Timeline was posted in May 9, 2025 at 3:58 pm. If you wanna have it as yours, please click the Pictures and you will go to click right mouse then Save Image As and Click Save and download the Google Sheets Gantt Chart Template With Timeline Picture.. Don’t forget to share this picture with others via Facebook, Twitter, Pinterest or other social medias! we do hope you'll get inspired by SampleTemplates123... Thanks again! If you have any DMCA issues on this post, please contact us!