Simple Google Sheets Gantt Chart Template With Hours
“`html
Google Sheets Gantt Chart Template with Hourly Resolution
Project management often demands meticulous scheduling, and for projects requiring a granular level of tracking, managing tasks by the hour is crucial. While sophisticated project management software offers robust Gantt chart capabilities, Google Sheets provides a simple and accessible solution for creating a Gantt chart with hourly resolution. This guide will walk you through creating a basic, yet effective, Gantt chart template in Google Sheets that allows you to schedule and visualize tasks on an hourly basis.
Understanding the Basics
A Gantt chart is a visual representation of a project schedule, displaying tasks over time. Traditionally, Gantt charts use days or weeks as the basic unit of time. To achieve hourly resolution in Google Sheets, we’ll adapt the standard Gantt chart approach and represent each hour as a column.
Setting up the Spreadsheet
- Create a New Google Sheet: Open Google Drive and create a new Google Sheet.
- Define Project Information: In the initial rows, input key project information such as project name, start date, and project manager. This provides context for the chart.
- Task List: In the first column (Column A), list all the tasks required for the project. Each task should occupy a separate row. Examples include “Design Mockup,” “Development Phase 1,” “Testing,” etc.
- Task Details: Add columns for task start date (Column B), start time (Column C), end date (Column D), and end time (Column E). Ensure that date and time formats are consistent. For instance, use “YYYY-MM-DD” for dates and “HH:MM” for times. Use the “Format -> Number” menu to specify the correct formats.
- Duration (in Hours): In Column F, calculate the task duration in hours. Use the following formula in cell F2, assuming the first task details are in row 2:
=((D2+E2)-(B2+C2))*24. Format the column to display numbers with appropriate decimal places. This formula calculates the difference between the end and start times (including dates) and multiplies by 24 to convert the result to hours.
Creating the Hourly Timeline
- Project Start Date Cell: In a separate cell (e.g., H1), enter the project start date. This will be the reference point for our hourly timeline.
- First Hour Column Header: In cell H2, enter the starting hour of the project, formatted to show both date and time based on the project start date in H1 (e.g., “2024-10-27 08:00”). Use the formula:
=H1if you want the first hour to align with the project start date in H1 or adjust the initial cell value as needed. You can then use “Format -> Number -> Custom date and time” to display this value as you prefer. - Subsequent Hour Column Headers: In cell I2, enter the formula to calculate the next hour:
=H2+(1/24). This adds one hour (1/24 of a day) to the previous hour. - Extend the Timeline: Drag the fill handle (the small square at the bottom-right of the cell) from cell I2 across as many columns as needed to cover the entire project duration. Each column header will now represent a specific hour within the project timeline. Determine how many columns you need by estimating the total project duration in hours and creating that many columns. Remember to format all header cells to display date and time correctly.
- Freeze Header Row and Columns: To keep the task list and hourly timeline visible while scrolling, freeze the first row and the first few columns (A to F) using “View -> Freeze”.
Conditional Formatting for the Gantt Chart
This is where the magic happens! We’ll use conditional formatting to visually represent task durations in the chart based on the start and end times.
- Select the Chart Area: Select the range of cells where you want the Gantt chart to appear (e.g., H3:ZZZ100, covering all tasks and hourly columns). Adjust the end column (ZZZ) and row (100) as necessary based on the number of tasks and project duration.
- Open Conditional Formatting: Go to “Format -> Conditional formatting”.
- Create the Rule:
- In the “Apply to range” field, confirm the selected range is correct.
- Under “Format rules”, choose “Custom formula is” from the “Format rules” dropdown.
- Enter the following formula (adjusting row numbers as needed):
=AND(H$2>=($B3+$C3), H$2<=($D3+$E3))Explanation of the Formula:
H$2: Refers to the date/time value in the header row (the current hour). The$sign before the '2' makes this an absolute reference, ensuring that the formula always compares to the header row.$B3+$C3: The start date and time of the task in row 3. The$sign before the 'B' makes this an absolute reference, ensuring the column does not change when conditional formatting is applied to other columns, but the row will change for other tasks.$D3+$E3: The end date and time of the task in row 3. The$sign before the 'D' makes this an absolute reference, ensuring the column does not change when conditional formatting is applied to other columns, but the row will change for other tasks.AND(): Ensures that both conditions (start time is before or equal to the hour *and* end time is after or equal to the hour) must be true for the formatting to be applied.
- Choose a fill color (e.g., blue) to represent the task duration.
- Click "Done".
Refining and Enhancements
- Weekend Highlighting: Use conditional formatting to highlight weekend columns (Saturday and Sunday) with a different color. Use a custom formula like `=WEEKDAY(H$2,2)>5` (assuming the timeline starts in column H) and apply it to the relevant range. `WEEKDAY(date, type)` returns a number representing the day of the week. Type 2 means Monday is 1 and Sunday is 7.
- Task Dependencies: While difficult to visualize dependencies directly in this basic hourly Gantt chart, you can use additional columns to note dependencies between tasks.
- Progress Tracking: Add a column to track task completion percentage. You could then use data bars or color scales to visually represent progress within each task's Gantt chart bar.
- Customization: Experiment with different colors, fonts, and borders to create a visually appealing and informative chart.
Limitations
This Google Sheets Gantt chart template, while useful for basic hourly scheduling, has limitations:
- Manual Updates: All updates, including task durations and dependencies, must be manually entered.
- Complexity: Managing large projects with numerous tasks and dependencies can become cumbersome in Google Sheets.
- Lack of Advanced Features: Features like critical path analysis, resource allocation, and automated reporting are not available.
Conclusion
Creating an hourly Gantt chart in Google Sheets provides a straightforward method for visualizing and managing projects that require detailed scheduling. While not as feature-rich as dedicated project management software, it offers a readily available and collaborative solution for smaller projects and teams. By understanding the principles of Gantt charts and utilizing Google Sheets' conditional formatting capabilities, you can create a custom template that effectively tracks tasks and deadlines with hourly precision.
```
 0 x 0 google sheets gantt chart template teamgantt from www.teamgantt.com
  1170×658 gantt chart excel template google sheets compatible from spitmarket.com
  1202×601 gantt chart google sheets template deeps from www.deepsonline.com
  1920×631 create gantt charts google sheets couplerio blog from blog.coupler.io
 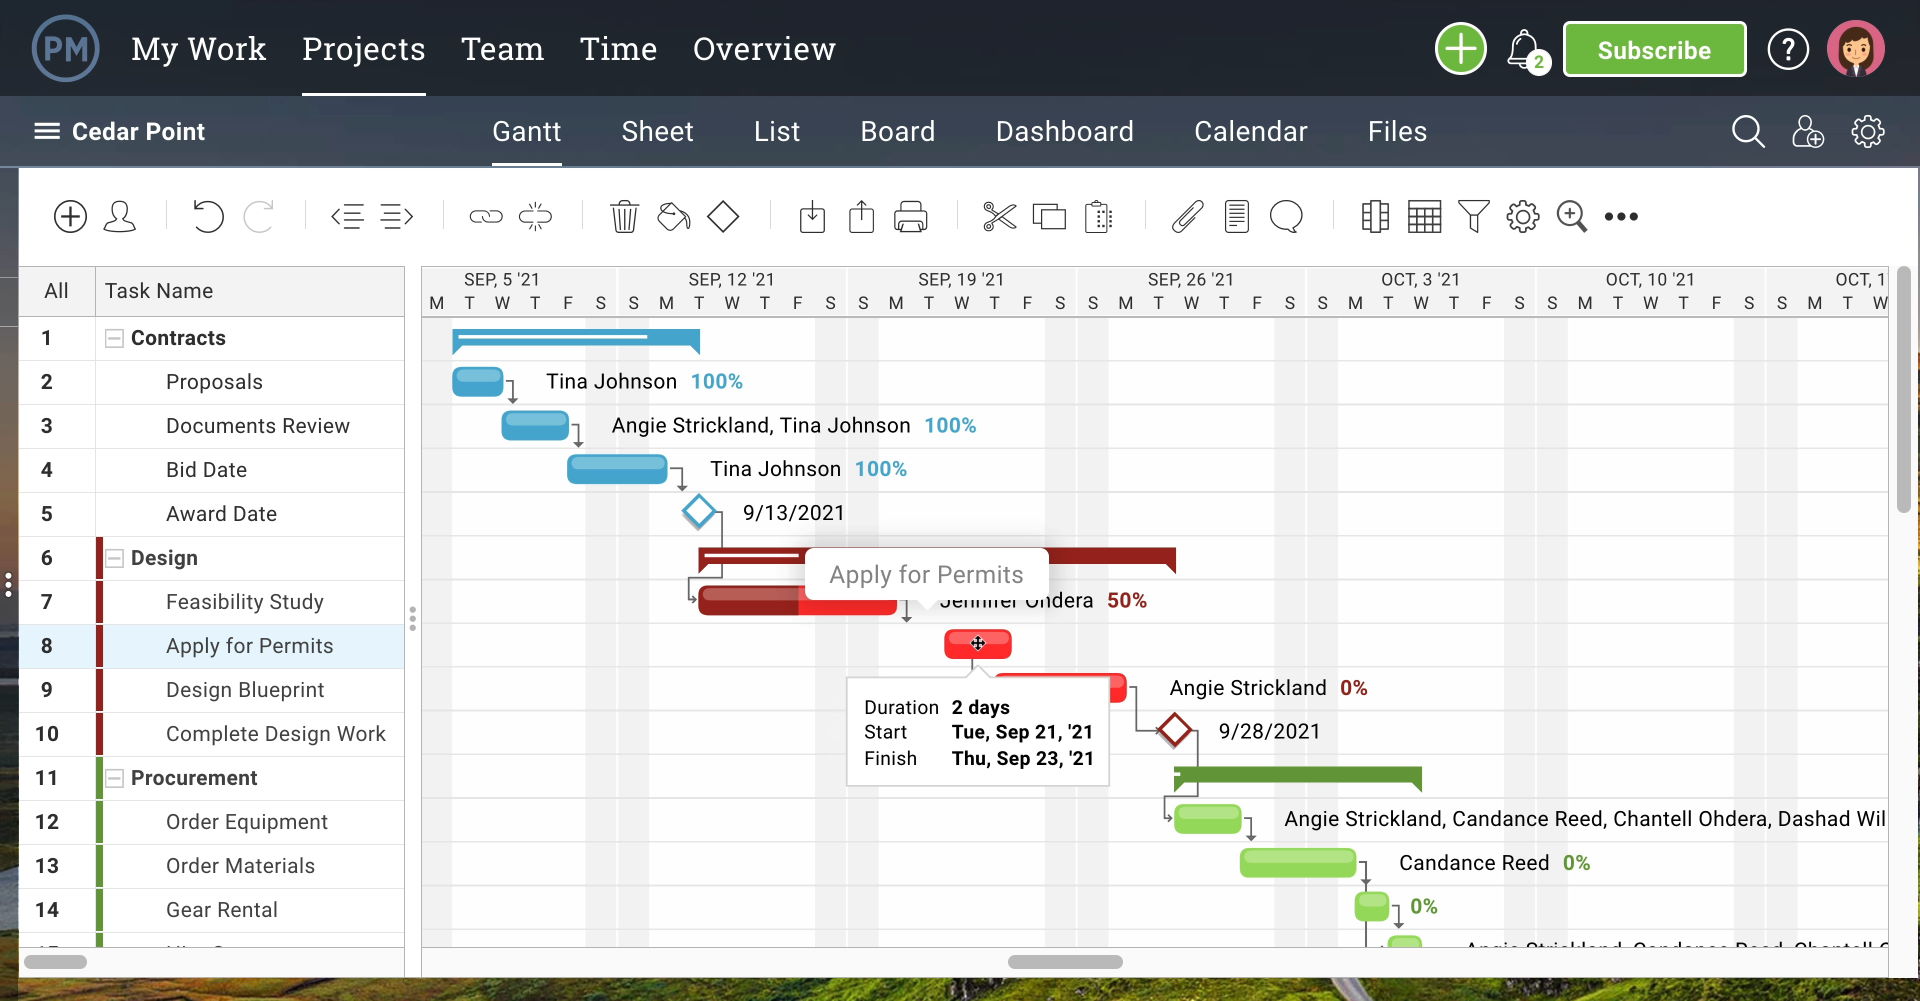 1920×1001 easy ways create gantt chart google sheets templates from www.projectmanager.com
 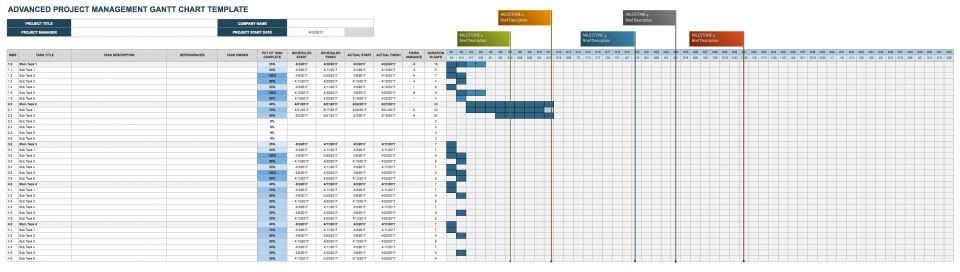 960×272 google sheets gantt chart templates smartsheet from www.smartsheet.com
  1300×781 gantt chart google sheets smartsheet from www.smartsheet.com
 Thank you for visiting Simple Google Sheets Gantt Chart Template With Hours. There are a lot of beautiful templates out there, but it can be easy to feel like a lot of the best cost a ridiculous amount of money, require special design. And if at this time you are looking for information and ideas regarding the Simple Google Sheets Gantt Chart Template With Hours then, you are in the perfect place. Get this Simple Google Sheets Gantt Chart Template With Hours for free here. We hope this post Simple Google Sheets Gantt Chart Template With Hours inspired you and help you what you are looking for.
Simple Google Sheets Gantt Chart Template With Hours was posted in January 10, 2026 at 5:16 pm. If you wanna have it as yours, please click the Pictures and you will go to click right mouse then Save Image As and Click Save and download the Simple Google Sheets Gantt Chart Template With Hours Picture.. Don’t forget to share this picture with others via Facebook, Twitter, Pinterest or other social medias! we do hope you'll get inspired by SampleTemplates123... Thanks again! If you have any DMCA issues on this post, please contact us!