Weekly Gantt Chart Template For Short-term Tasks
Weekly Gantt Chart Template for Short-Term Tasks
Effectively manage and visualize your tasks with this customizable weekly Gantt chart template.
Understanding the Need for a Weekly Gantt Chart
In today’s fast-paced work environment, managing short-term projects and daily tasks efficiently is critical. A weekly Gantt chart provides a clear, visual representation of your schedule, allowing you to track progress, allocate resources, and identify potential bottlenecks in real-time. Unlike traditional Gantt charts designed for long-term projects, a weekly Gantt chart focuses specifically on tasks within a seven-day timeframe, making it ideal for individuals, small teams, and projects with rapid iterations and quick turnaround times.
The benefits of using a weekly Gantt chart are numerous. It enhances productivity by providing a focused view of current priorities, promoting accountability, and fostering better time management. With a visual representation of task dependencies and deadlines, you can ensure projects stay on track and potential delays are addressed promptly. Moreover, it allows for efficient resource allocation, preventing overcommitment and maximizing team effectiveness.
Components of a Weekly Gantt Chart Template
A well-designed weekly Gantt chart template should include several key components for optimal functionality:
- Task List: This is a comprehensive list of all tasks to be completed within the week. Each task should be clearly defined with a concise description.
- Start and End Dates: These fields specify the precise start and end dates for each task. For tasks spanning multiple days, the duration is clearly defined.
- Duration: This indicates the estimated time needed to complete each task, typically measured in hours or days. Accurate duration estimates are crucial for effective scheduling.
- Dependencies: Identify any dependencies between tasks. Indicate which tasks must be completed before others can begin. This highlights critical paths and potential bottlenecks.
- Assignee: Assign each task to a specific individual or team responsible for its completion. This fosters accountability and clarity.
- Progress: Track the progress of each task, typically represented as a percentage completed. This allows for real-time monitoring and identification of tasks behind schedule.
- Visual Timeline: This is the core of the Gantt chart. Each task is represented by a horizontal bar on a timeline, visually illustrating the start and end dates, duration, and progress.
- Notes/Comments: A section for adding notes, comments, or additional details related to each task. This provides a space for context and communication.
Creating Your Weekly Gantt Chart Template
You can create a weekly Gantt chart template using various tools, including:
- Spreadsheet Software (e.g., Excel, Google Sheets): These offer flexibility and customization options. You can manually create the chart using formulas and conditional formatting.
- Project Management Software (e.g., Asana, Trello, Monday.com): These platforms offer built-in Gantt chart functionalities and collaboration features.
- Dedicated Gantt Chart Software (e.g., GanttProject, TeamGantt): These tools are specifically designed for Gantt chart creation and offer advanced features.
Regardless of the tool you choose, follow these steps to create your template:
- Define Your Time Scale: Set the time scale to represent a single week, typically Monday to Sunday.
- List Your Tasks: Create a detailed task list, breaking down larger tasks into smaller, manageable subtasks.
- Estimate Durations: Accurately estimate the duration of each task, considering potential challenges and resource constraints.
- Identify Dependencies: Determine the dependencies between tasks and indicate which tasks rely on the completion of others.
- Assign Resources: Assign each task to a specific individual or team member, ensuring accountability.
- Input Data: Enter the task descriptions, start and end dates, durations, dependencies, and assignees into your chosen tool.
- Visualize the Timeline: Use the tool’s Gantt chart functionality to create a visual timeline, representing each task as a horizontal bar.
- Customize the Chart: Customize the chart’s appearance by adding colors, labels, and progress indicators.
- Add Notes/Comments: Include a section for adding notes, comments, or additional details related to each task.
- Save Your Template: Save the completed chart as a template for future use.
Tips for Effective Use of a Weekly Gantt Chart
To maximize the effectiveness of your weekly Gantt chart, consider these tips:
- Regularly Update the Chart: Keep the chart up-to-date by tracking progress, adjusting timelines, and adding new tasks as needed.
- Communicate Effectively: Share the chart with your team members and encourage them to provide updates and feedback.
- Use Color Coding: Use color coding to visually represent task status, priority, or assignee.
- Monitor Critical Paths: Pay close attention to tasks on the critical path, as delays in these tasks can impact the entire project.
- Be Realistic with Estimates: Avoid underestimating task durations, as this can lead to unrealistic schedules and potential delays.
- Embrace Flexibility: Be prepared to adjust the chart as unexpected events or changes in priorities occur.
- Use Milestones: Incorporate milestones to mark significant progress points or deliverables within the week.
- Review at the End of the Week: Dedicate time at the end of each week to review the chart, assess progress, and identify areas for improvement.
Example Weekly Gantt Chart Scenario
Imagine a marketing team launching a new social media campaign. The weekly tasks might include:
- Monday: Create social media graphics (John), Write social media copy (Jane)
- Tuesday: Schedule social media posts (Jane), Review graphics and copy (Team Lead)
- Wednesday: Launch initial campaign posts (Jane), Monitor engagement (Team)
- Thursday: Analyze initial campaign performance (Team), Adjust strategy based on data (Team Lead)
- Friday: Create content for next week’s posts (John, Jane)
The Gantt chart would visually represent these tasks, their durations, dependencies (e.g., graphics and copy must be completed before scheduling), and assignees. The progress of each task would be tracked throughout the week, allowing the team to quickly identify any roadblocks and ensure the campaign stays on schedule.
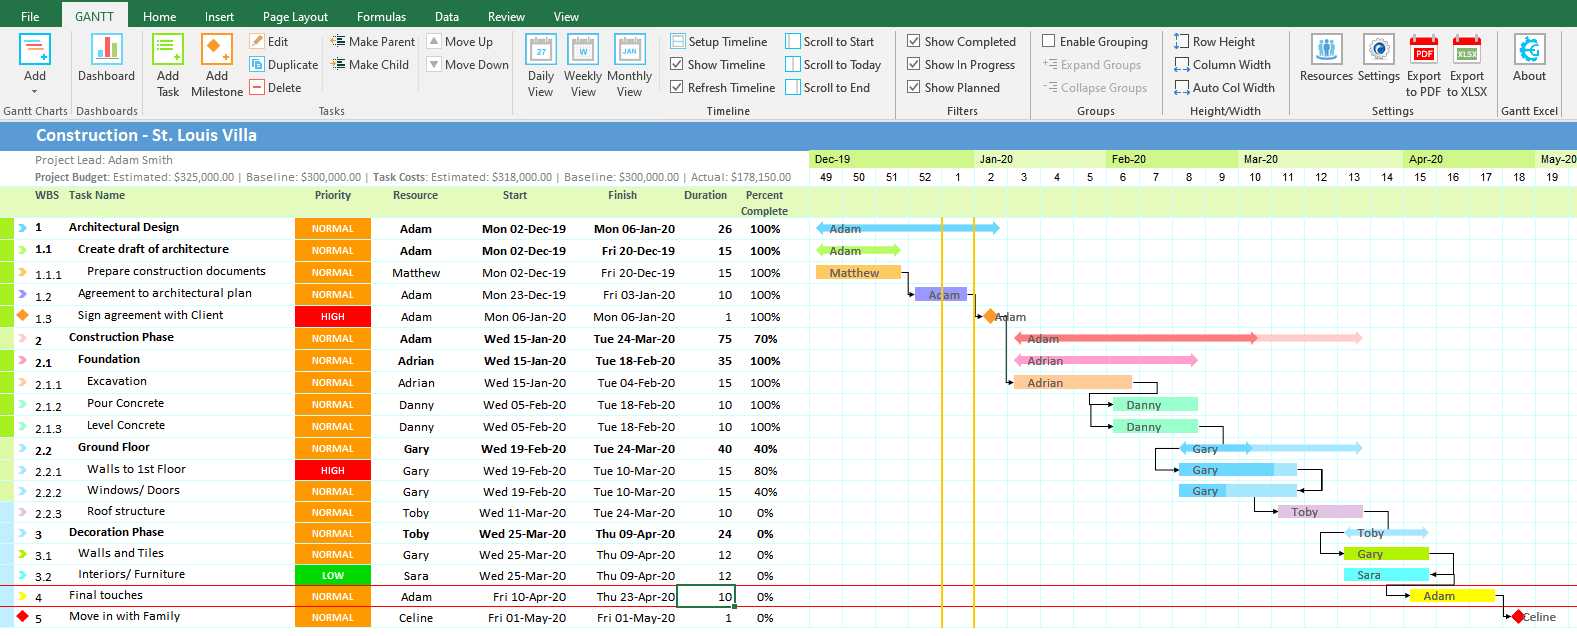 1577×636 weekly gantt chart gantt excel from www.ganttexcel.com
  700×540 gantt chart template documents word excel from www.dexform.com
  1056×816 gantt chart weekly based template templates gantt chart from db-excel.com
  900×860 gantt chart templates excel from www.template.net
 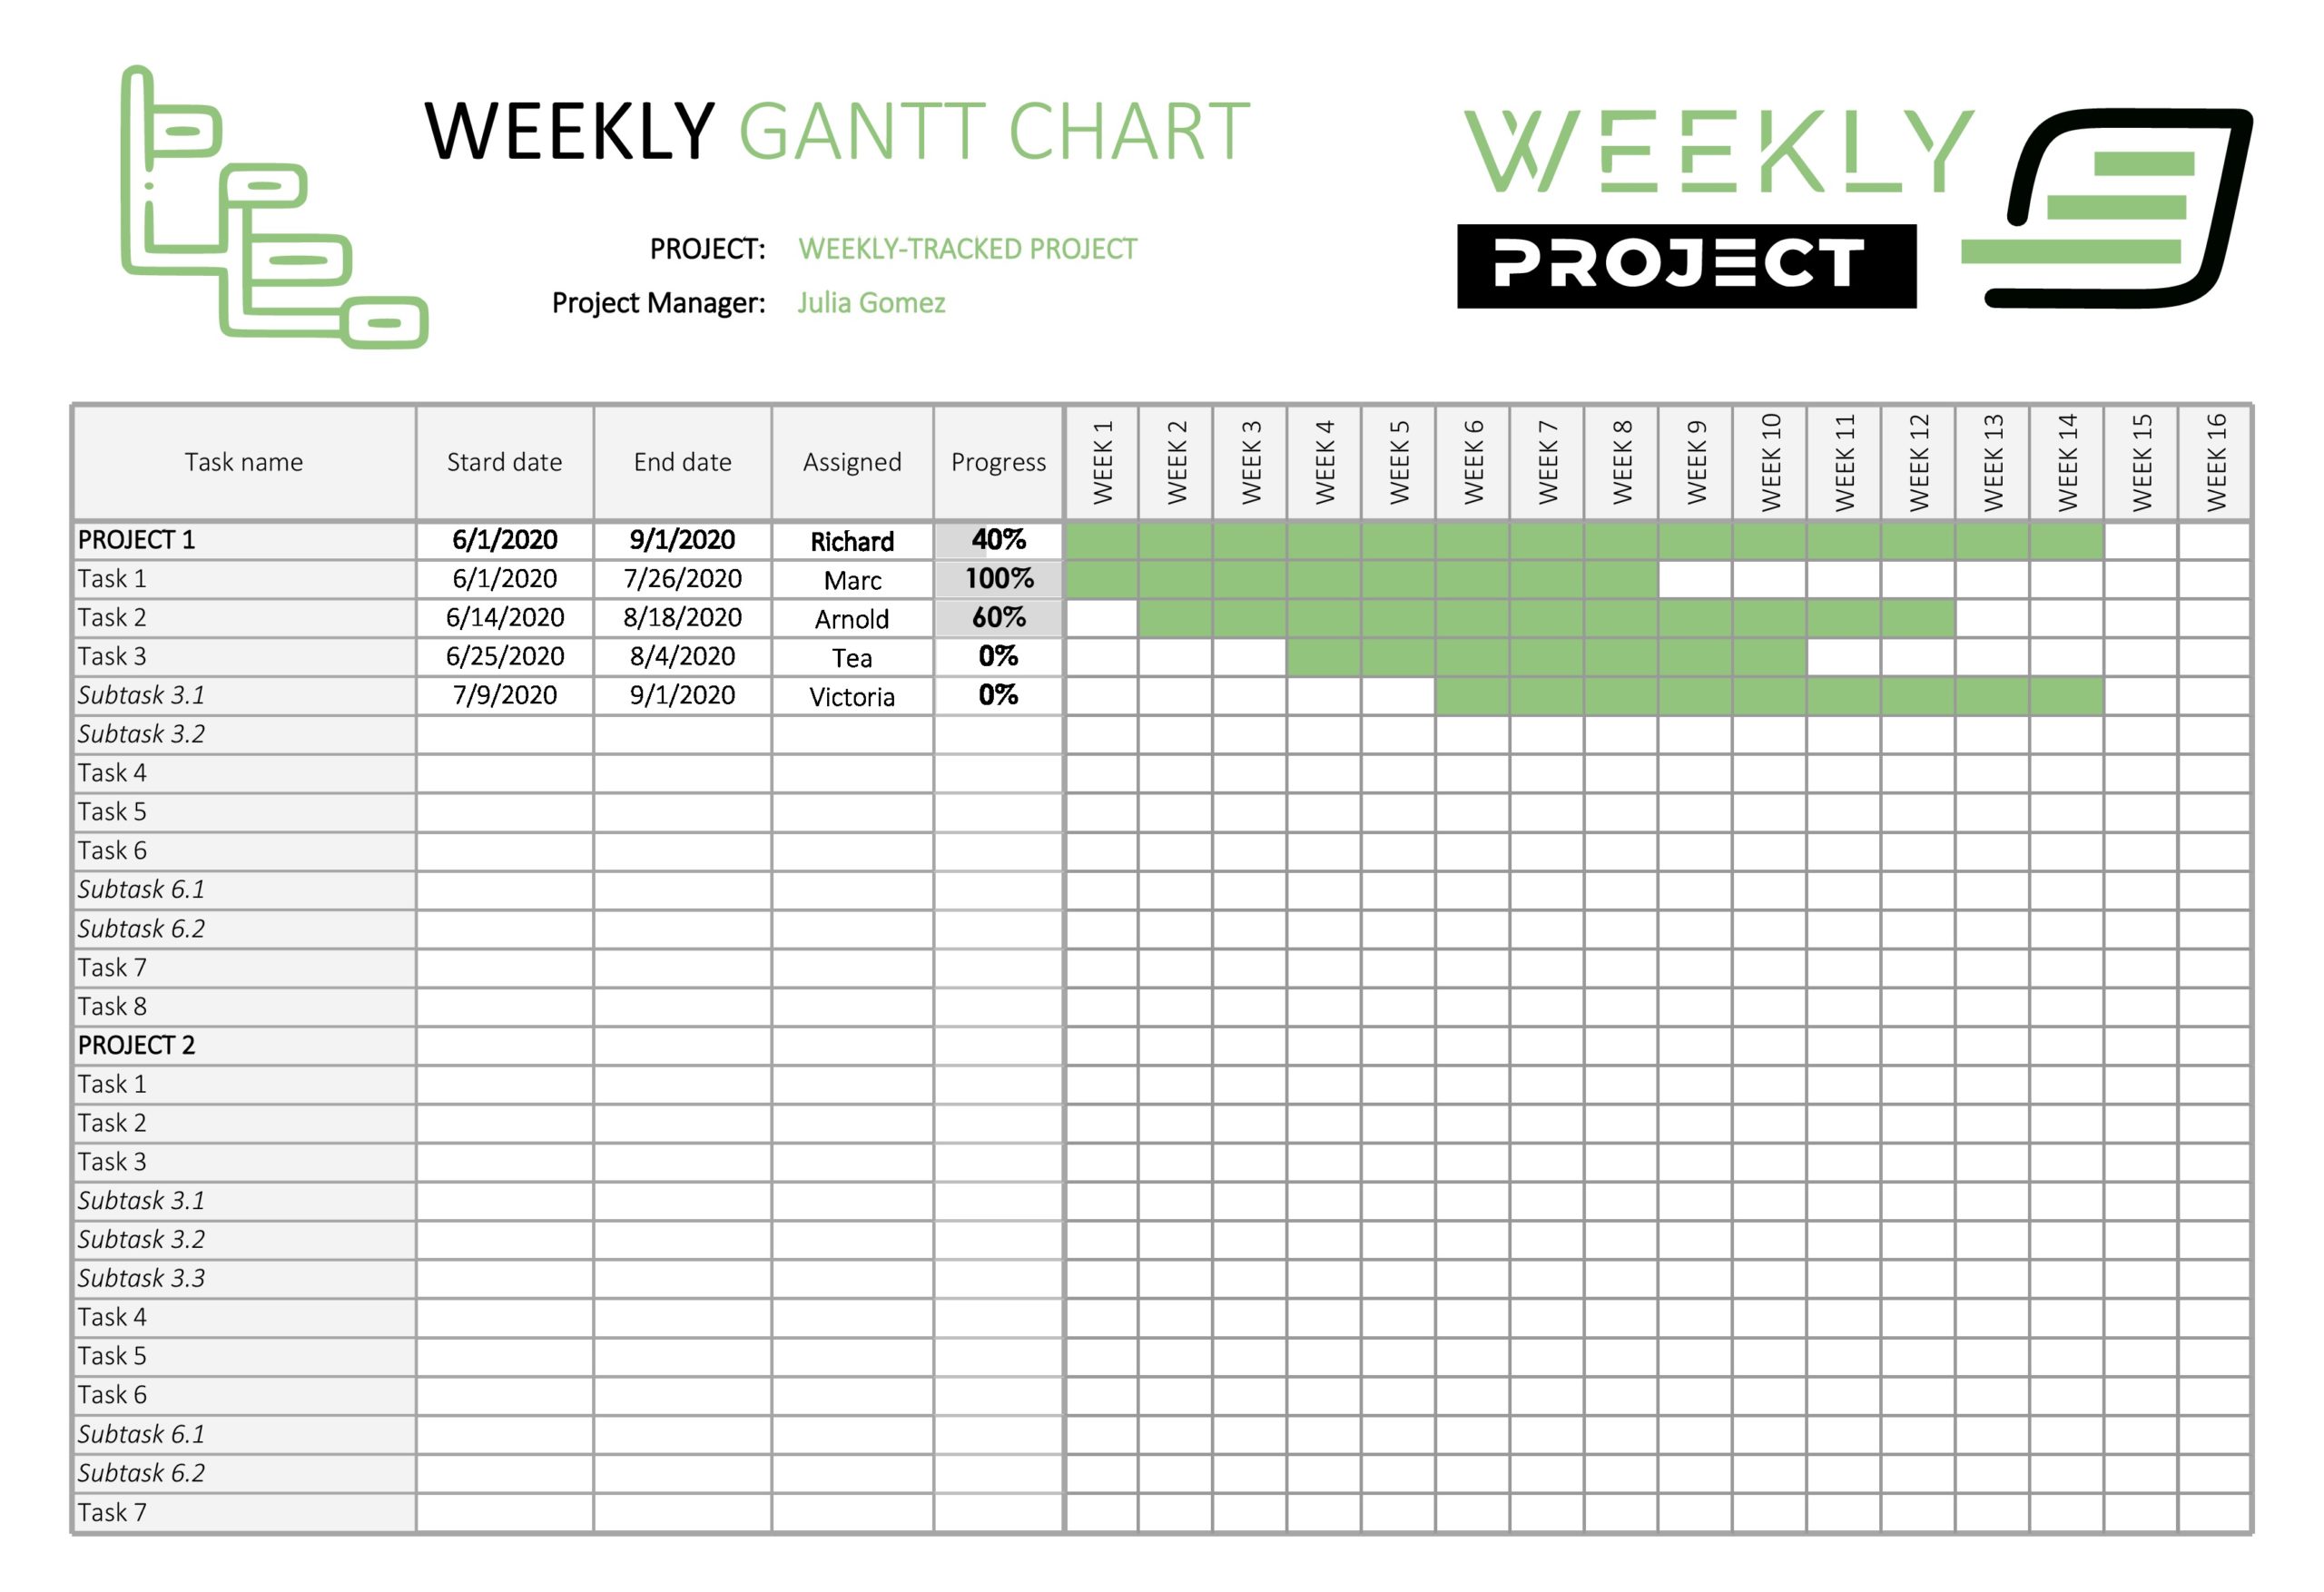 2560×1754 gantt chart templates excel powerpoint word templatelab from templatelab.com
 Thank you for visiting Weekly Gantt Chart Template For Short-term Tasks. There are a lot of beautiful templates out there, but it can be easy to feel like a lot of the best cost a ridiculous amount of money, require special design. And if at this time you are looking for information and ideas regarding the Weekly Gantt Chart Template For Short-term Tasks then, you are in the perfect place. Get this Weekly Gantt Chart Template For Short-term Tasks for free here. We hope this post Weekly Gantt Chart Template For Short-term Tasks inspired you and help you what you are looking for.
Weekly Gantt Chart Template For Short-term Tasks was posted in February 13, 2026 at 11:52 am. If you wanna have it as yours, please click the Pictures and you will go to click right mouse then Save Image As and Click Save and download the Weekly Gantt Chart Template For Short-term Tasks Picture.. Don’t forget to share this picture with others via Facebook, Twitter, Pinterest or other social medias! we do hope you'll get inspired by SampleTemplates123... Thanks again! If you have any DMCA issues on this post, please contact us!