Blueprint Development Gantt Chart Excel File
Blueprint Development: Mastering Project Timelines with Gantt Charts in Excel
Effective blueprint development hinges on meticulous planning and precise execution. A critical tool for achieving this is the Gantt chart, providing a visual representation of project timelines, tasks, dependencies, and milestones. Utilizing Excel to create a Gantt chart offers a readily accessible and customizable solution for managing blueprint projects, regardless of their complexity. This document explores the creation and effective utilization of Gantt charts in Excel for blueprint development, detailing the steps involved, best practices, and advanced techniques.
Understanding the Fundamentals of a Gantt Chart
A Gantt chart is essentially a bar chart that visually represents a project schedule. Each task or activity is represented by a horizontal bar, with the bar’s length corresponding to the task’s duration. The chart also displays the start and end dates of each task, their dependencies, and any critical milestones. This visual representation allows project managers and stakeholders to quickly grasp the project’s overall progress, identify potential bottlenecks, and make informed decisions. For blueprint development, a Gantt chart can be invaluable for tracking progress on various phases such as initial conceptualization, detailed design, review cycles, revisions, and final approval. It helps in coordinating the efforts of different teams or individuals involved, ensuring everyone is aligned on timelines and responsibilities.
Creating a Basic Gantt Chart in Excel
While specialized project management software exists, Excel provides a simple and effective method for creating and managing Gantt charts. Here’s a step-by-step guide: 1. **Data Input:** The foundation of your Gantt chart lies in accurate data. In an Excel spreadsheet, create columns for the following information: * **Task:** Description of the individual task (e.g., “Conceptual Design,” “Structural Analysis,” “Electrical Layout”). * **Start Date:** The date the task is scheduled to begin. * **Duration (Days):** The estimated number of days required to complete the task. * **End Date (Optional):** While Excel can calculate this, you can also manually input it for clarity. This column can be derived using the formula: `=Start Date + Duration – 1`. 2. **Chart Selection:** Select the ‘Task’ and ‘Start Date’ columns. Navigate to the “Insert” tab on the Excel ribbon and choose a “Stacked Bar” chart. This will create a basic chart that needs further modification. 3. **Reordering Tasks (Optional):** Excel typically plots data in reverse order. To display tasks in a logical top-to-bottom sequence, right-click on the vertical (task) axis and select “Format Axis.” Under “Axis Options,” check the “Categories in reverse order” box. 4. **Hiding the Start Date Series:** The initial chart shows two bars for each task: one representing the start date and one for the duration. To create the Gantt chart effect, we need to hide the “Start Date” series. Right-click on one of the “Start Date” bars and select “Format Data Series.” In the “Fill” section, choose “No Fill.” In the “Border” section, choose “No Line.” This makes the “Start Date” bars invisible, leaving only the duration bars visible. 5. **Adding Error Bars for Dependencies (Optional):** If tasks are dependent on each other, you can visually represent this using error bars. Add a new column labeled “Predecessor Task” and enter the task number that each task depends on. Then add another column called “Dependency Offset (Days)” that indicates the number of days to wait before starting the next task. Use the error bar feature on your duration bars to graphically depict these dependencies. 6. **Customization:** Enhance the chart’s readability and visual appeal: * **Axis Labels:** Customize the axis labels to display relevant dates and task descriptions clearly. * **Colors:** Use different colors to distinguish task categories or phases. * **Gridlines:** Add or remove gridlines to improve clarity. * **Chart Title:** Provide a descriptive chart title. * **Data Labels:** Consider adding data labels to the duration bars to display the task duration or end date.
Advanced Techniques for Enhancing Gantt Charts
Beyond the basic setup, several advanced techniques can further enhance the functionality and visual representation of your Gantt chart: * **Conditional Formatting:** Use conditional formatting to highlight overdue tasks, critical tasks, or tasks nearing completion. This adds a dynamic element to the chart, providing immediate visual cues. For example, you can create a rule that automatically changes the color of a task’s bar if its end date is in the past. * **Formulas and Functions:** Leverage Excel’s formulas to automate calculations, such as calculating the project completion date, determining critical path activities, and tracking task progress. You can use the `TODAY()` function to compare planned dates with the current date. You can also implement progress tracking by adding a “Percent Complete” column and using a formula to visually represent the percentage completed on the task bar. * **Progress Tracking:** Integrate progress tracking by adding a “Percent Complete” column to your data table. You can then use this data to create a visual representation of task progress on the Gantt chart. One way to achieve this is by layering another bar chart on top of the duration bar, with the fill color representing the percentage complete. * **Milestone Indicators:** Add visual indicators to represent key milestones in the project. This could involve using different shapes or markers on the chart to highlight important deadlines or deliverables. * **Resource Allocation:** Include columns for resource allocation to track which individuals or teams are responsible for each task. This provides a comprehensive view of resource utilization and helps in managing workload distribution.
Best Practices for Using Gantt Charts in Blueprint Development
* **Regular Updates:** Keep the Gantt chart updated regularly to reflect actual progress and any changes in the project timeline. This ensures the chart remains a reliable tool for tracking and managing the project. * **Collaboration:** Share the Gantt chart with all stakeholders involved in the blueprint development process. This promotes transparency and facilitates collaboration. * **Clear Communication:** Use the Gantt chart as a communication tool to discuss project progress, identify potential issues, and make decisions. * **Realistic Estimates:** Ensure that task duration estimates are realistic and based on historical data or expert judgment. * **Flexibility:** Be prepared to adjust the Gantt chart as needed to accommodate changes in project scope, resources, or timelines. By mastering the creation and utilization of Gantt charts in Excel, you can effectively manage blueprint development projects, improve communication, and ensure timely completion of deliverables. While specialized project management software offers advanced features, Excel provides a readily accessible and customizable solution for a wide range of blueprinting needs.
 474×254 gantt chart excel gantt chart excel template from gantt-chart-excel.com
  1024×738 easyprojectplan excel gantt chart screenshots windows from easyprojectplan-excel-gantt-chart.win7dwnld.com
 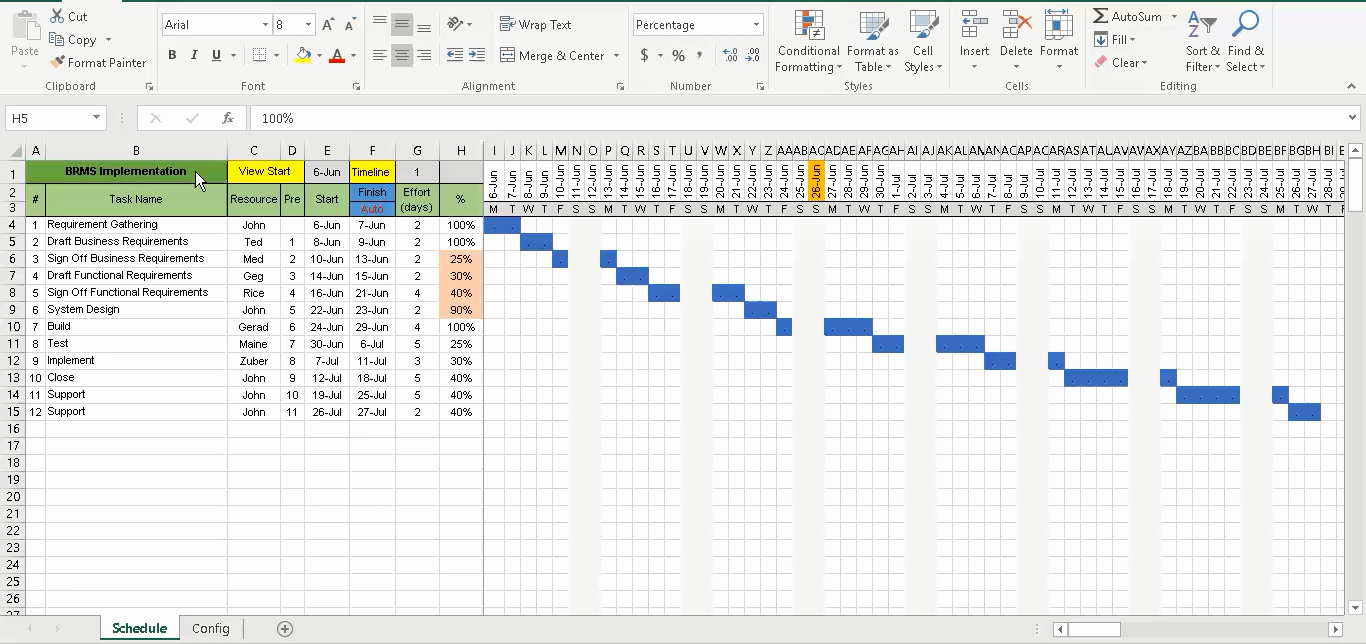 1366×644 construction gantt chart excel template from shootersjournal.net
  1300×621 gantt chart templates excel tools smartsheet from www.smartsheet.com
  978×970 gantt chart construction template excel db excelcom from db-excel.com
 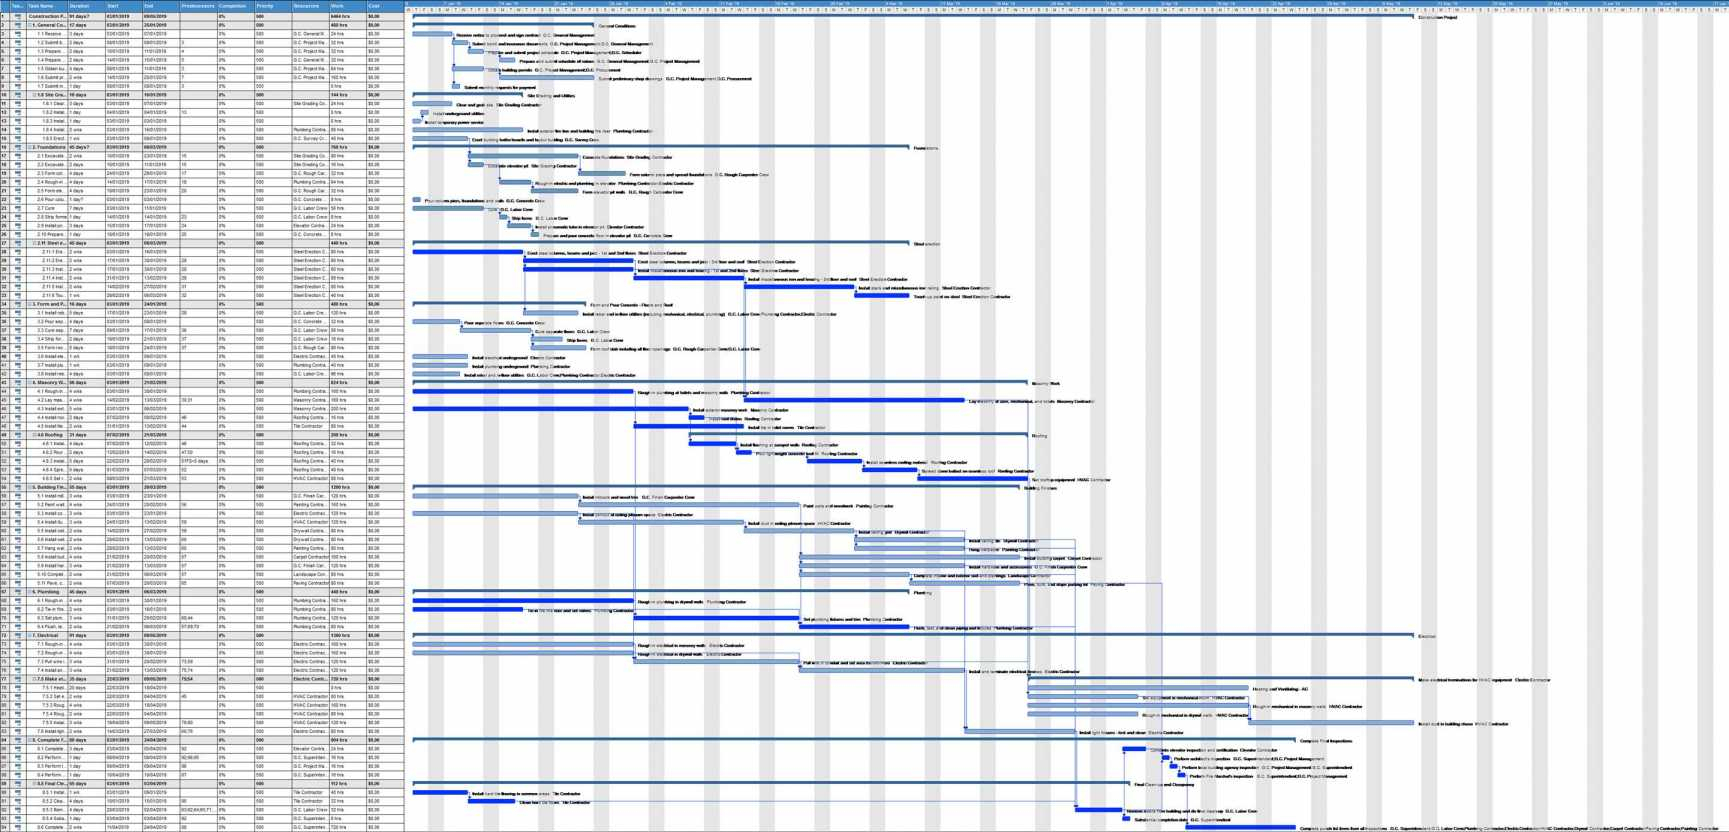 1729×832 gantt chart construction template excel spreadshee gantt from db-excel.com
  735×431 gantt charts excel templates tutorial video smartsheet from www.smartsheet.com
  900×554 create gantt chart excel smartsheet from www.smartsheet.com
  1232×884 construction gantt chart excel template printable receipt template from www.printablereceipttemplate.com
  1280×720 build gantt chart excel chart walls from chartwalls.blogspot.com
 Thank you for visiting Blueprint Development Gantt Chart Excel File. There are a lot of beautiful templates out there, but it can be easy to feel like a lot of the best cost a ridiculous amount of money, require special design. And if at this time you are looking for information and ideas regarding the Blueprint Development Gantt Chart Excel File then, you are in the perfect place. Get this Blueprint Development Gantt Chart Excel File for free here. We hope this post Blueprint Development Gantt Chart Excel File inspired you and help you what you are looking for.
Blueprint Development Gantt Chart Excel File was posted in July 23, 2025 at 6:39 pm. If you wanna have it as yours, please click the Pictures and you will go to click right mouse then Save Image As and Click Save and download the Blueprint Development Gantt Chart Excel File Picture.. Don’t forget to share this picture with others via Facebook, Twitter, Pinterest or other social medias! we do hope you'll get inspired by SampleTemplates123... Thanks again! If you have any DMCA issues on this post, please contact us!