Dynamic Gantt Chart Linked To Excel Database
Dynamic Gantt Charts Linked to Excel: A Powerful Project Management Tool
Gantt charts are indispensable tools for project managers, providing a visual representation of project schedules, tasks, dependencies, and progress. They offer a clear overview of project timelines and help in resource allocation and tracking. While static Gantt charts are useful, dynamic Gantt charts linked directly to an Excel database offer a significant upgrade in efficiency, flexibility, and real-time project monitoring.
The Power of Dynamic Linkage
The primary advantage of linking a Gantt chart to an Excel database is the dynamic connection. Changes made in the Excel sheet, such as task updates, start dates, durations, or dependencies, automatically reflect in the Gantt chart. This eliminates the need for manual updates in both systems, saving considerable time and reducing the risk of errors. This seamless synchronization allows for instant visualization of project impacts, enabling better decision-making and proactive adjustments.
Why Excel as the Database?
Excel’s ubiquity and familiarity make it a powerful and accessible database solution for many organizations. Most users are already comfortable with Excel’s interface and functionalities, reducing the learning curve. Furthermore, Excel provides robust data management capabilities, including sorting, filtering, and formulas, allowing for effective data organization and manipulation. Its compatibility with various software and platforms further strengthens its appeal.
Creating a Dynamic Gantt Chart Linked to Excel
Several methods exist for creating dynamic Gantt charts connected to Excel. One popular approach utilizes charting tools within Excel itself, while another involves third-party Gantt chart software that offers direct integration with Excel.
1. Excel-Based Gantt Chart: Conditional Formatting Approach
This method leverages Excel’s built-in features, particularly conditional formatting, to visually represent the Gantt chart. * **Data Preparation:** Create an Excel sheet with columns for Task Name, Start Date, Duration (in days), End Date (calculated using a formula), and Completion Percentage. Ensure dates are formatted correctly. * **Chart Area:** Select a range of cells to represent the Gantt chart timeline. The columns will represent days or weeks, depending on the project’s duration. * **Conditional Formatting:** Use conditional formatting with formulas to highlight cells corresponding to task durations. For example, a formula might check if a specific date falls within a task’s start and end dates and, if so, apply a color fill to that cell. * **Completion Indicators:** Add another layer of conditional formatting to visually represent task completion percentage. Use data bars or color scales based on the Completion Percentage column. * **Pros:** Simple to implement, utilizes familiar Excel skills, requires no additional software. * **Cons:** Can be less visually appealing and customizable compared to dedicated Gantt chart software. Limited interactive features. Performance can degrade with large datasets.
2. Gantt Chart Software with Excel Integration
Numerous project management and Gantt chart software solutions offer direct integration with Excel. These tools provide richer features and more visually appealing charts. * **Selection and Installation:** Choose a suitable Gantt chart software that explicitly advertises Excel integration. Install the software and familiarize yourself with its features. * **Data Import/Linking:** Most software offers options to import data directly from an Excel file or establish a live link. With a live link, any changes in the Excel sheet automatically update the Gantt chart. * **Chart Customization:** Use the software’s features to customize the Gantt chart’s appearance, including colors, fonts, dependencies, milestones, and resource allocation. * **Progress Tracking:** Utilize features for tracking task progress, displaying completion percentages, and highlighting critical paths. * **Reporting and Collaboration:** Leverage the software’s reporting capabilities to generate progress reports and share the Gantt chart with stakeholders. Many tools offer collaboration features, allowing team members to update tasks and communicate within the platform. * **Pros:** More visually appealing, richer features, better interactivity, easier collaboration, enhanced reporting capabilities. * **Cons:** Requires purchasing and learning new software, potential compatibility issues between software versions.
Benefits of Using a Dynamic Gantt Chart
* **Real-Time Visualization:** Get an up-to-the-minute view of project progress. * **Improved Decision-Making:** Understand the impact of changes on project timelines and resource allocation. * **Enhanced Collaboration:** Share a single source of truth with the entire team. * **Increased Efficiency:** Eliminate manual updates and reduce errors. * **Better Resource Allocation:** Optimize resource allocation based on task dependencies and timelines. * **Proactive Issue Identification:** Identify potential delays and bottlenecks early on. * **Simplified Reporting:** Generate progress reports with ease. * **Improved Communication:** Clearly communicate project status to stakeholders.
Best Practices for Implementation
* **Data Consistency:** Ensure data consistency in the Excel sheet. Use data validation to restrict input to valid formats. * **Clear Column Definitions:** Clearly define the purpose and format of each column in the Excel sheet. * **Formula Verification:** Double-check all formulas to ensure accuracy. * **Regular Updates:** Encourage team members to update task progress regularly. * **Version Control:** Implement version control for the Excel file to track changes and prevent data loss. * **Training and Support:** Provide training and support to team members on how to use the system effectively. * **Backup Strategy:** Implement a regular backup strategy for the Excel file to prevent data loss.
Conclusion
Dynamic Gantt charts linked to Excel databases offer a powerful and efficient way to manage projects. By automating updates and providing real-time visualization, they empower project managers to make informed decisions, improve collaboration, and ultimately deliver projects successfully. Whether utilizing Excel’s built-in charting tools or dedicated Gantt chart software, the benefits of a dynamic linked system are undeniable. By following best practices and tailoring the solution to specific project needs, organizations can significantly enhance their project management capabilities and achieve greater success.
 1080×680 excel progress gantt chart gantt chart excel template from gantt-chart-excel.com
 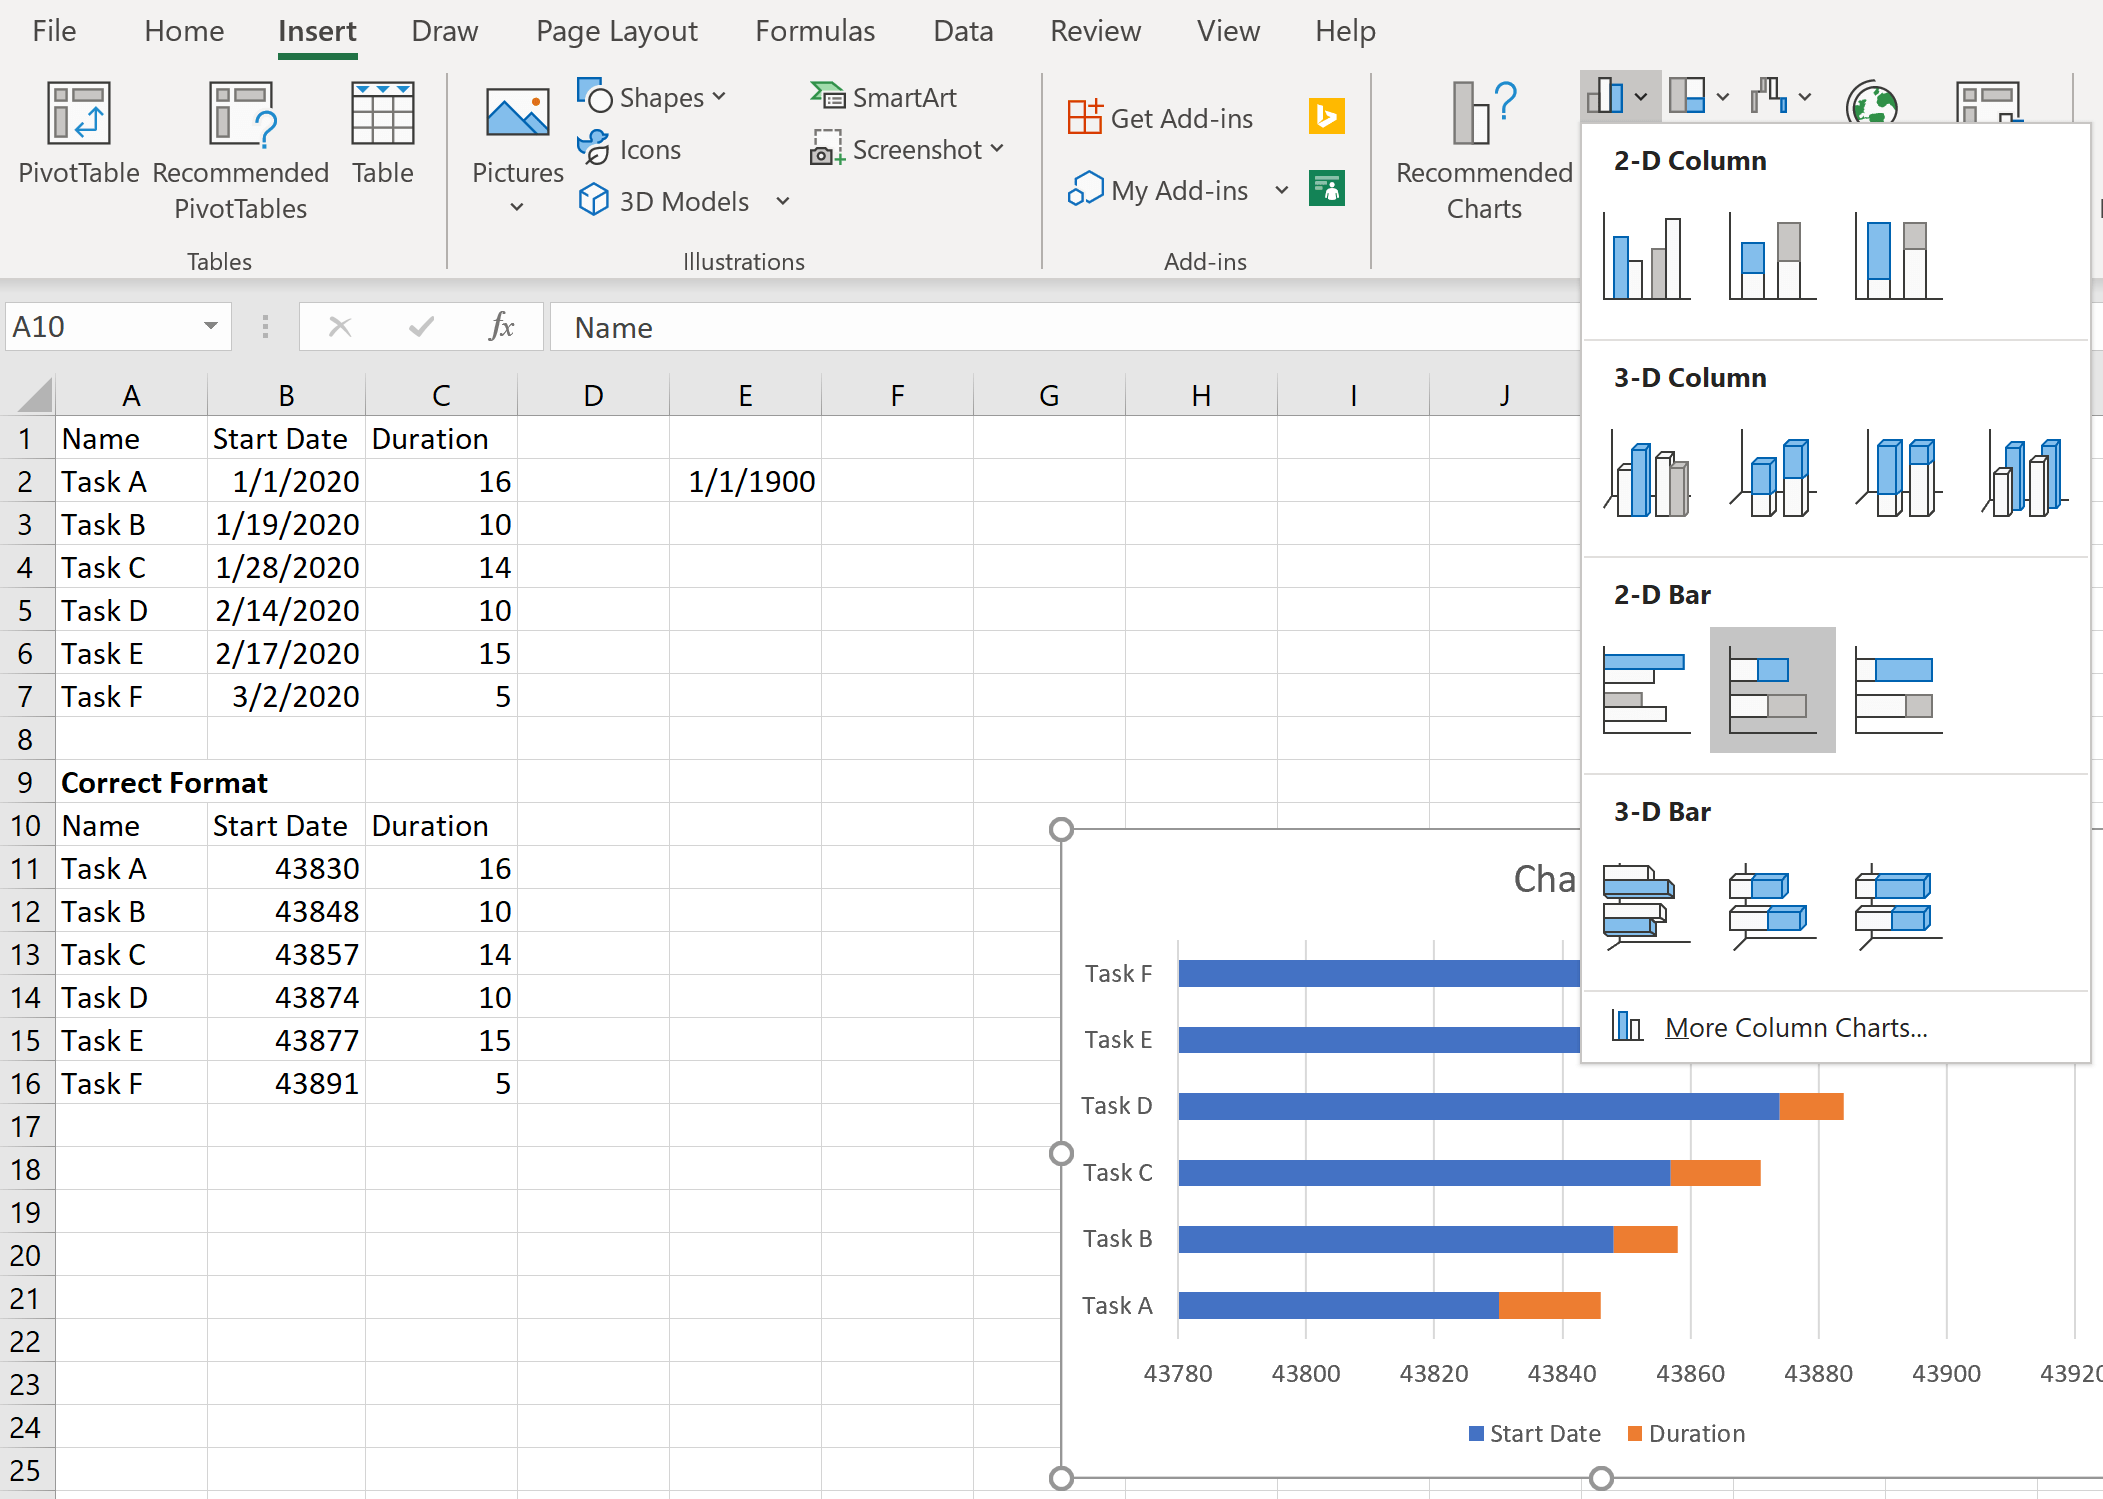 2103×1499 create gantt chart excel from www.statology.org
  640×205 dynamic excel gantt chart from www.engineeringmanagement.info
 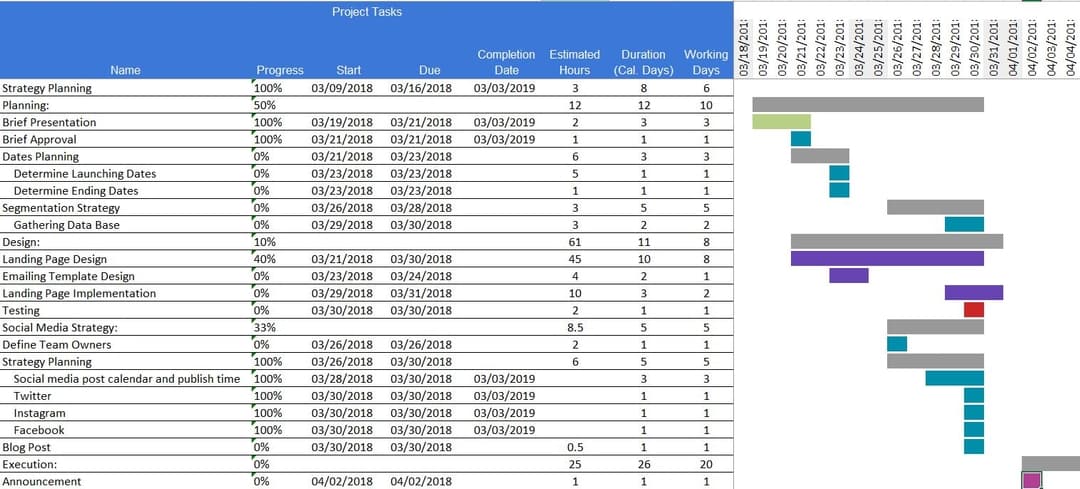 1080×489 instagantt blog export gantt chart excel from instagantt.com
 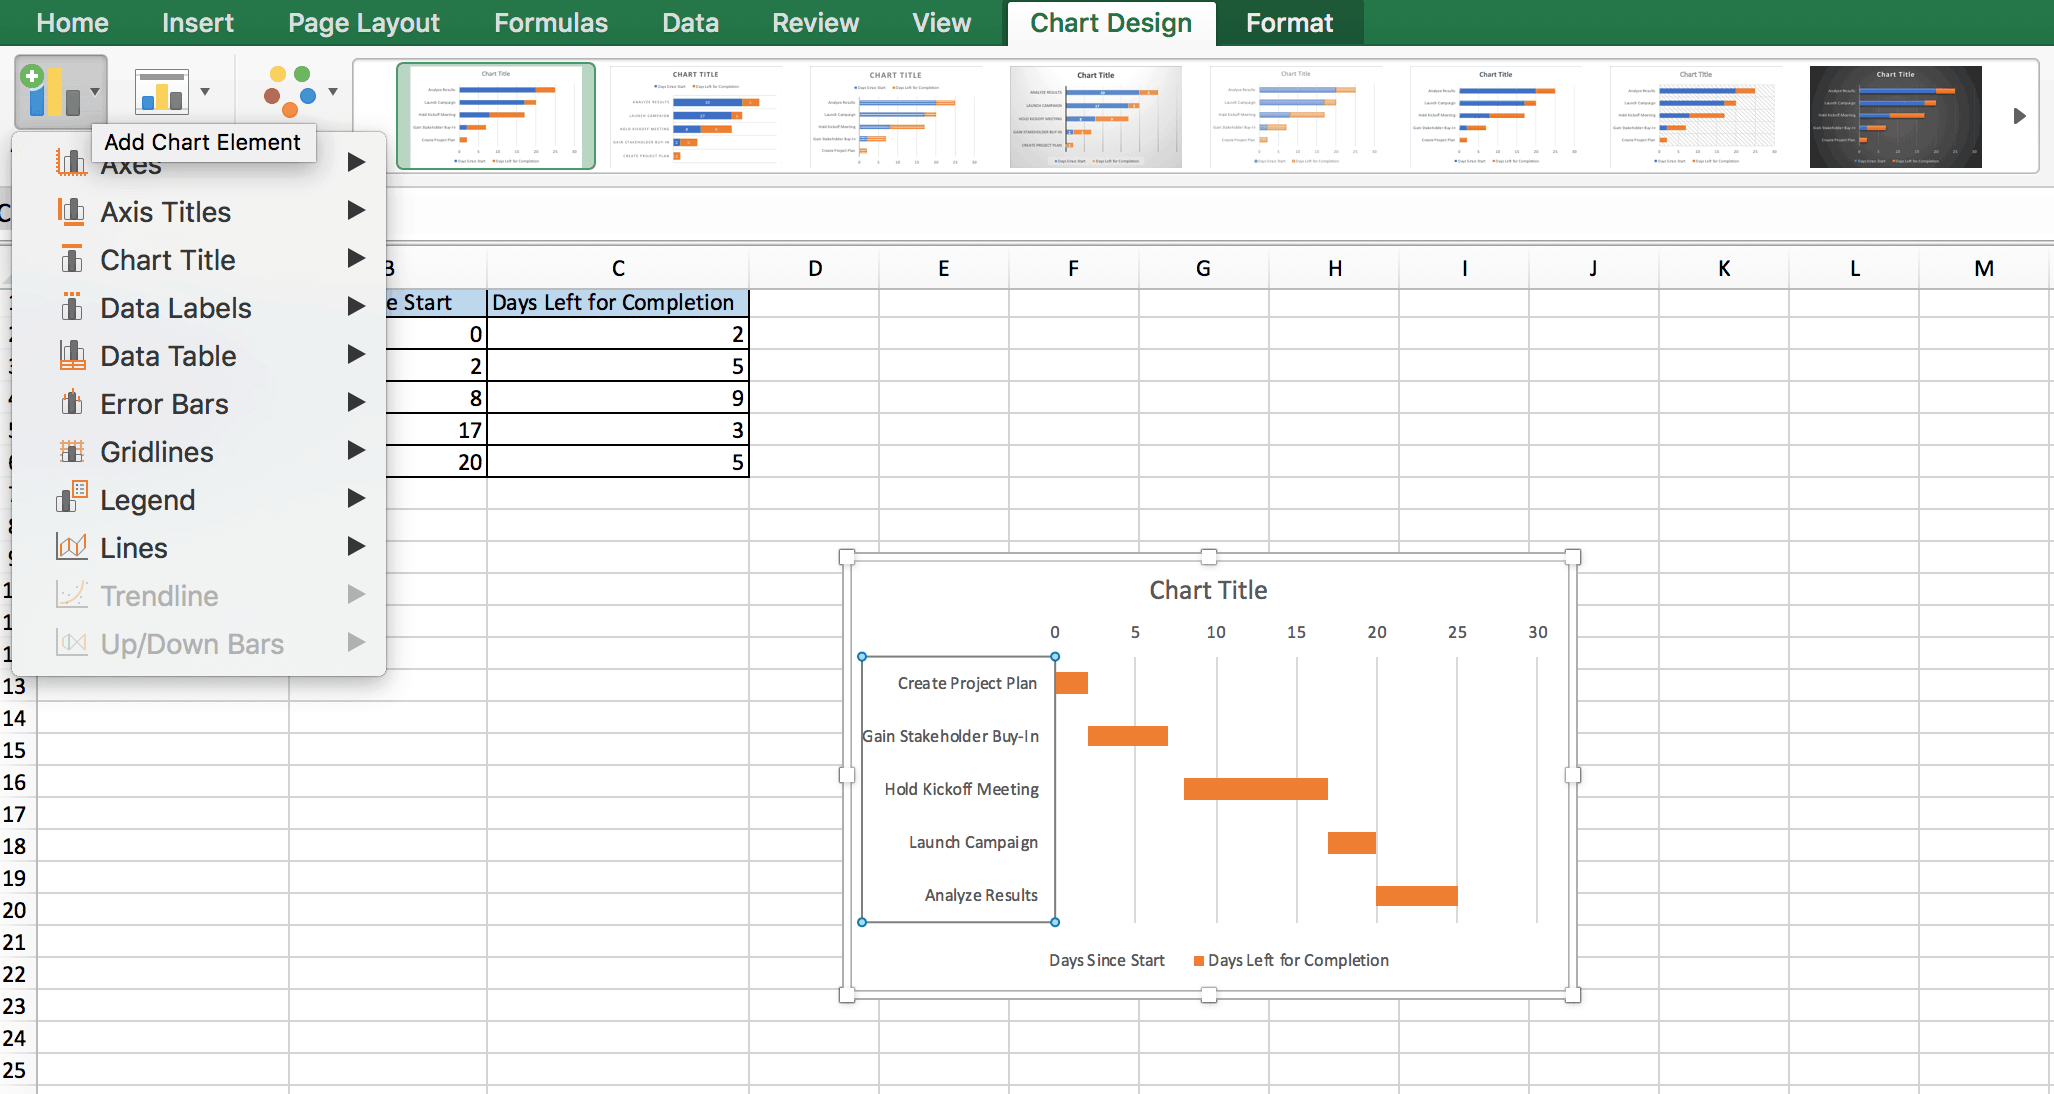 2054×1094 gantt charts excel templates tutorial video smartsheet from smartsheet.com
 Thank you for visiting Dynamic Gantt Chart Linked To Excel Database. There are a lot of beautiful templates out there, but it can be easy to feel like a lot of the best cost a ridiculous amount of money, require special design. And if at this time you are looking for information and ideas regarding the Dynamic Gantt Chart Linked To Excel Database then, you are in the perfect place. Get this Dynamic Gantt Chart Linked To Excel Database for free here. We hope this post Dynamic Gantt Chart Linked To Excel Database inspired you and help you what you are looking for.
Dynamic Gantt Chart Linked To Excel Database was posted in July 4, 2025 at 2:45 am. If you wanna have it as yours, please click the Pictures and you will go to click right mouse then Save Image As and Click Save and download the Dynamic Gantt Chart Linked To Excel Database Picture.. Don’t forget to share this picture with others via Facebook, Twitter, Pinterest or other social medias! we do hope you'll get inspired by SampleTemplates123... Thanks again! If you have any DMCA issues on this post, please contact us!