How To Analyze Blog Performance Metrics
Analyzing Blog Performance Metrics: A Comprehensive Guide
Understanding how your blog performs is crucial for growth, audience engagement, and achieving your overall content marketing goals. Without tracking and analyzing the right metrics, you’re essentially flying blind. This guide outlines key performance indicators (KPIs) and provides a roadmap for analyzing them effectively.
I. Defining Your Blog Goals
Before diving into metrics, clarify your objectives. What do you hope to achieve with your blog? Common goals include:
- Brand Awareness: Expanding your reach and introducing your brand to a wider audience.
- Lead Generation: Capturing contact information from potential customers.
- Sales: Directly driving product sales or service sign-ups.
- Thought Leadership: Establishing yourself as an expert in your industry.
- Customer Engagement: Building relationships and fostering a community around your brand.
- Website Traffic: Increasing the overall traffic to your website.
Your goals will dictate which metrics are most important to track. For instance, if your primary goal is lead generation, you’ll focus heavily on conversion rates and form submissions.
II. Key Blog Performance Metrics
Here’s a breakdown of essential metrics and how to interpret them:
A. Website Traffic Metrics
- Overall Traffic: The total number of visits to your blog. Track this over time to identify trends (growth, decline, seasonality). Tools like Google Analytics provide this data.
- Analysis: A steady increase in overall traffic suggests your content is resonating with your audience and your marketing efforts are paying off. A decline could indicate outdated content, decreased search engine visibility, or a lack of promotional activity.
- Pageviews: The total number of times your blog pages were viewed. This can be higher than overall traffic if visitors view multiple pages per session.
- Analysis: Pageviews provide insights into user engagement. High pageviews combined with low traffic suggest visitors are exploring your blog thoroughly.
- Unique Visitors: The number of individual people who visited your blog during a specific period.
- Analysis: This metric helps you understand the size of your audience. Compare it to overall traffic to gauge how often visitors return to your blog. A high ratio of unique visitors to overall traffic might mean you need to focus on encouraging repeat visits.
- Traffic Sources: Where your blog visitors are coming from (e.g., organic search, social media, referral links, direct traffic).
- Analysis: This information is crucial for understanding which marketing channels are most effective. If a significant portion of your traffic comes from organic search, focus on SEO. If social media is a key driver, optimize your social media strategy. Low referral traffic might indicate a lack of backlink building or collaboration with other websites.
- Bounce Rate: The percentage of visitors who leave your blog after viewing only one page.
- Analysis: A high bounce rate (e.g., above 70%) can indicate that your content is not relevant to the search query, your website design is poor, or your page load speed is slow. Investigate these factors to improve user experience. A lower bounce rate (e.g., below 40%) generally indicates that visitors are finding your content engaging and relevant.
- Average Session Duration: The average amount of time visitors spend on your blog per session.
- Analysis: Longer session durations suggest visitors are finding your content valuable and engaging. Short session durations could indicate that your content is not meeting their needs or that your website is difficult to navigate.
B. Content Performance Metrics
- Top Performing Posts: Identify your most popular blog posts based on pageviews, session duration, and social shares.
- Analysis: Analyze the characteristics of your top-performing posts (topic, format, writing style, visuals). Replicate these elements in future content. Consider updating or repurposing your best-performing content to keep it fresh and relevant.
- Bottom Performing Posts: Identify blog posts with low pageviews, high bounce rates, and few social shares.
- Analysis: Determine why these posts are underperforming. Is the topic irrelevant? Is the content poorly written? Is the SEO lacking? Consider updating, rewriting, or even deleting these posts.
- Reading Time: How long, on average, readers are spending actively reading each post. Many analytics platforms offer tools to track this.
- Analysis: Comparing this to overall time on page helps you understand if people are actually consuming the content, or just leaving the page open in a tab. This can show you what writing styles are the most engaging.
C. Engagement Metrics
- Comments: The number of comments on your blog posts.
- Analysis: Comments indicate active engagement and a willingness to participate in discussions. Respond to comments to foster a sense of community. Consider asking questions at the end of your posts to encourage discussion.
- Social Shares: The number of times your blog posts are shared on social media platforms.
- Analysis: Social shares indicate that your content is valuable and shareable. Track which platforms generate the most shares and tailor your social media promotion accordingly.
- Time on Page/Scroll Depth: How far down the page visitors scroll before leaving.
- Analysis: If users aren’t scrolling to the bottom, critical content may be missed. It may be necessary to break down your articles, increase engagement higher up, or implement strategies to keep visitors scrolling.
- Feedback Forms/Surveys: If you use these, track the responses carefully.
- Analysis: This is direct feedback from your readers. Use this information to directly address their concerns and build a better blog.
D. Conversion Metrics
- Lead Generation: The number of leads generated through your blog (e.g., form submissions, newsletter sign-ups, ebook downloads).
- Analysis: Track the conversion rate for each lead generation offer. Optimize your calls-to-action (CTAs) and landing pages to improve conversion rates. A/B test different CTAs and landing page designs to see what performs best.
- Click-Through Rate (CTR): The percentage of visitors who click on a specific link or CTA within your blog post.
- Analysis: A low CTR indicates that your CTAs are not compelling or relevant. Experiment with different wording, placement, and design to improve CTR.
- Sales Conversions: The number of sales generated directly from your blog.
- Analysis: If your blog is directly driving sales, track the conversion rate and revenue generated. Attribute sales to specific blog posts to understand which content is most effective at converting visitors into customers.
III. Tools for Analyzing Blog Performance
- Google Analytics: The industry-standard web analytics platform. Provides comprehensive data on website traffic, user behavior, and conversions.
- Google Search Console: Offers insights into how your blog is performing in Google search results. Helps you identify crawl errors, optimize your sitemap, and track your keyword rankings.
- Social Media Analytics: Each social media platform (e.g., Facebook, Twitter, LinkedIn) provides its own analytics tools. Use these tools to track social shares, engagement, and reach.
- Marketing Automation Platforms: Platforms like HubSpot, Marketo, and Pardot offer advanced analytics and reporting features, including lead tracking, email marketing analytics, and campaign performance.
IV. Analyzing the Data
Collecting data is only the first step. The real value comes from analyzing the data and using it to inform your content strategy.
- Set Benchmarks: Establish baseline metrics for your blog. Track your progress against these benchmarks to identify areas for improvement.
- Identify Trends: Look for patterns in your data. Are certain topics consistently generating more traffic and engagement? Are there specific days or times when your blog traffic is higher?
- Segment Your Data: Analyze your data by traffic source, user demographics, or device type. This will help you identify specific audience segments and tailor your content to their needs.
- A/B Testing: Experiment with different versions of your blog posts, CTAs, and landing pages to see what performs best. Use A/B testing to optimize your content for maximum impact.
- Regular Reporting: Create regular reports that summarize your blog performance metrics. Share these reports with your team and use them to track progress toward your goals.
V. Taking Action Based on Insights
The ultimate goal of blog performance analysis is to improve your content and achieve your business objectives. Here are some actions you can take based on your insights:
- Optimize Content: Update or rewrite underperforming blog posts. Improve the SEO of your content by targeting relevant keywords and building backlinks.
- Refine Content Strategy: Focus on topics that are generating the most traffic and engagement. Experiment with different content formats (e.g., videos, infographics, podcasts).
- Improve User Experience: Optimize your website design for usability. Improve page load speed. Make it easier for visitors to find the information they are looking for.
- Promote Your Content: Share your blog posts on social media. Build relationships with other bloggers and influencers. Use email marketing to promote your content to your subscribers.
- Adjust Your Goals: Regularly review your blog goals and adjust them as needed. As your blog grows and evolves, your goals may change.
By consistently tracking, analyzing, and acting on your blog performance metrics, you can optimize your content strategy, improve user engagement, and achieve your desired business outcomes.
 1200×803 metrics measure blog post performance from robertkatai.com
 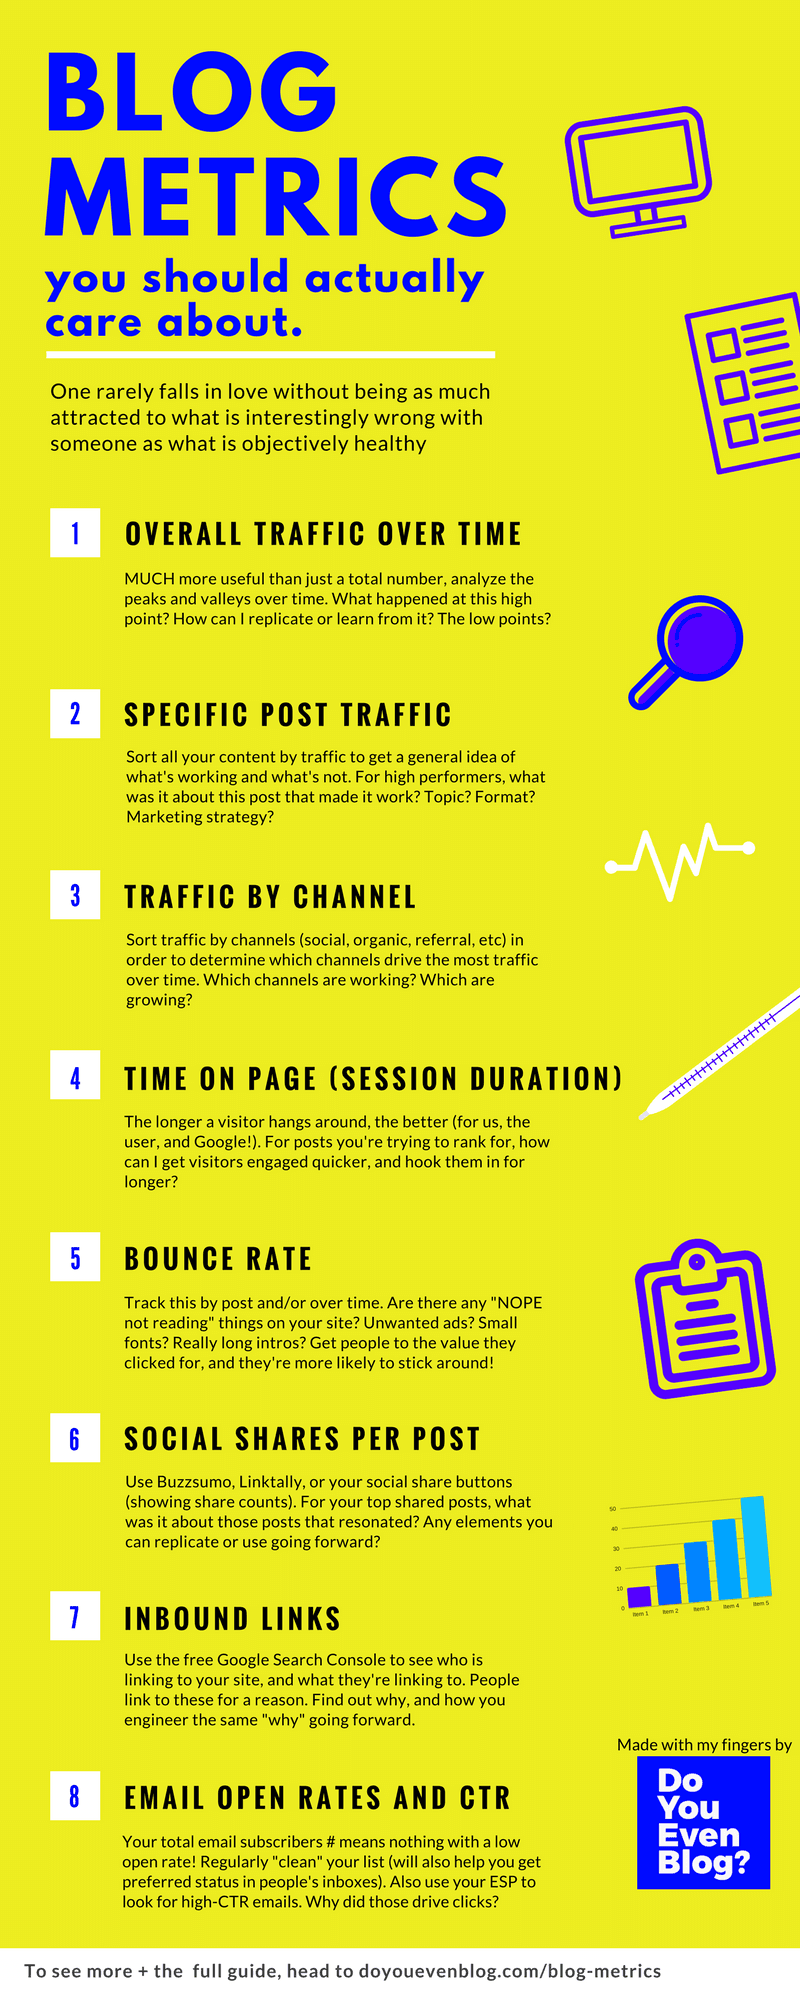 800×2000 blog metrics growth from doyouevenblog.com
  2000×1333 website performance metrics analyze siteuptime blog from www.siteuptime.com
  654×322 analyze blog metrics measure seopressor from seopressor.com
  1500×544 performance metrics telling story from archetypeconsulting.com
  1000×572 google analytics metrics measuring blogs performance from prometteursolutions.com
  2048×702 important metrics measure blogs performance from www.spiralytics.com
  1280×529 measure blog performance google analytics from www.lupagedigital.com
 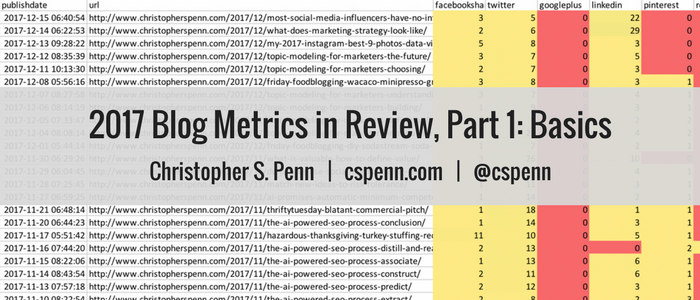 700×300 blog metrics review part basics christopher penn from www.christopherspenn.com
 Thank you for visiting How To Analyze Blog Performance Metrics. There are a lot of beautiful templates out there, but it can be easy to feel like a lot of the best cost a ridiculous amount of money, require special design. And if at this time you are looking for information and ideas regarding the How To Analyze Blog Performance Metrics then, you are in the perfect place. Get this How To Analyze Blog Performance Metrics for free here. We hope this post How To Analyze Blog Performance Metrics inspired you and help you what you are looking for.
How To Analyze Blog Performance Metrics was posted in June 13, 2025 at 5:47 pm. If you wanna have it as yours, please click the Pictures and you will go to click right mouse then Save Image As and Click Save and download the How To Analyze Blog Performance Metrics Picture.. Don’t forget to share this picture with others via Facebook, Twitter, Pinterest or other social medias! we do hope you'll get inspired by SampleTemplates123... Thanks again! If you have any DMCA issues on this post, please contact us!