Excel Gantt Chart Template With Timeline
Excel Gantt Chart Template with Timeline
A Gantt chart is a powerful project management tool that visually represents a project schedule. It helps you break down complex projects into manageable tasks, assign resources, set deadlines, and track progress over time. While specialized project management software offers robust Gantt chart features, Microsoft Excel provides a readily accessible and customizable alternative, especially through the use of templates.
Why Use an Excel Gantt Chart Template?
Excel Gantt chart templates offer several advantages:
- Accessibility: Most users are familiar with Excel, making it easy to learn and use.
- Cost-Effective: Avoid expensive project management software subscriptions.
- Customization: Tailor the template to fit your specific project needs.
- Collaboration: Share the spreadsheet with team members for easy updates and tracking.
- Simplicity: Ideal for smaller projects where complex features of dedicated software aren’t necessary.
Key Components of an Excel Gantt Chart Template with Timeline
A typical Excel Gantt chart template consists of the following essential components:
- Task List: A list of all tasks required to complete the project. Each task should be clearly defined and easily understandable.
- Start Date: The scheduled date when each task is expected to begin.
- End Date (or Duration): Either the scheduled completion date for each task or the estimated duration (in days, weeks, etc.) required to complete the task. The template usually calculates the end date automatically based on the start date and duration.
- Dependencies (Predecessors): Indicates the relationship between tasks. If one task depends on the completion of another, this column specifies the preceding task’s ID. This ensures tasks are performed in the correct order.
- Resources (Assignees): The individuals or teams responsible for completing each task.
- Progress (Percentage Complete): Shows the current percentage of completion for each task. This allows for visual tracking of project progress.
- Timeline (Chart): The visual representation of the project schedule. This is a horizontal bar chart where each bar represents a task, and its length corresponds to the task’s duration. The timeline typically displays dates along the top, allowing you to quickly see when tasks are scheduled to begin and end.
Creating a Gantt Chart Template in Excel (Simplified)
While numerous pre-made templates are readily available, understanding the basic principles allows for greater customization. Here’s a simplified overview of how a basic Gantt chart is created:
- Set up the data table: Create columns for Task, Start Date, End Date, Duration, and % Complete. Fill in the task details.
- Calculate Duration (if needed): If you’re using Start Date and End Date, calculate the duration by subtracting the Start Date from the End Date. (e.g., `End Date – Start Date`)
- Create a stacked bar chart:
- Select the Task and Start Date columns.
- Insert a “Stacked Bar” chart.
- Right-click on the chart, and “Select Data.”
- Add a new series for “Duration” (or End Date minus Start Date if using Duration column). Ensure the ‘Category (X) axis labels’ are set to the ‘Task’ column.
- Format the chart:
- Hide the “Start Date” bars by setting their fill color to “No Fill.” This makes the Duration bars appear to start at the correct date.
- Adjust the horizontal axis (dates) to start and end at relevant project dates. Format the axis for appropriate date display.
- Add data labels for % Complete and display them on the chart. Consider conditional formatting to visually highlight tasks nearing deadlines or exceeding planned durations.
Tips for Using and Customizing a Gantt Chart Template
- Use clear and concise task descriptions: Avoid ambiguity to ensure everyone understands their responsibilities.
- Accurately estimate task durations: Underestimating can lead to delays; overestimating can inflate the project timeline.
- Regularly update the chart: Keep the chart current with progress updates to maintain accurate visibility.
- Use conditional formatting: Highlight tasks based on status, deadlines, or resource allocation. For example, color-code tasks that are overdue, on track, or completed.
- Manage dependencies effectively: Clearly define task dependencies to avoid bottlenecks. Use the template to automatically adjust the timeline when a dependent task’s schedule changes.
- Add milestones: Mark significant project milestones to track overall progress.
- Use data validation: Implement drop-down lists for resources and task status to ensure data consistency.
- Consider using Excel’s built-in functions: Functions like `TODAY()` can be used for highlighting overdue tasks, and `NETWORKDAYS()` can calculate working days for durations, excluding weekends.
- Review and revise: Continuously review the Gantt chart with your team and revise the plan as needed to address unforeseen challenges.
Beyond the Basics: Enhancing Your Excel Gantt Chart
Once you’re comfortable with the basics, you can enhance your template with features like:
- Resource allocation charts: Visualize resource usage to identify potential overloads.
- Critical path analysis: Identify the sequence of tasks that directly impact the project’s completion date.
- Automated task reminders: Use VBA scripting to send email reminders as tasks approach their deadlines.
- Reporting dashboards: Create visual dashboards summarizing project progress and key metrics.
Conclusion
An Excel Gantt chart template provides a flexible and accessible solution for managing smaller projects and visually tracking progress. By understanding the key components and customization options, you can create a powerful tool to effectively plan, execute, and monitor your projects from start to finish. Remember to adapt the template to your specific needs and continuously update it to reflect the current project status.
 1024×1024 excel gantt chart flexible project spreadsheet luxtemplates from luxtemplates.com
 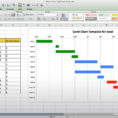 118×118 gantt chart timeline template excel db excelcom from db-excel.com
  1024×768 gantt chart excel template db excelcom from db-excel.com
 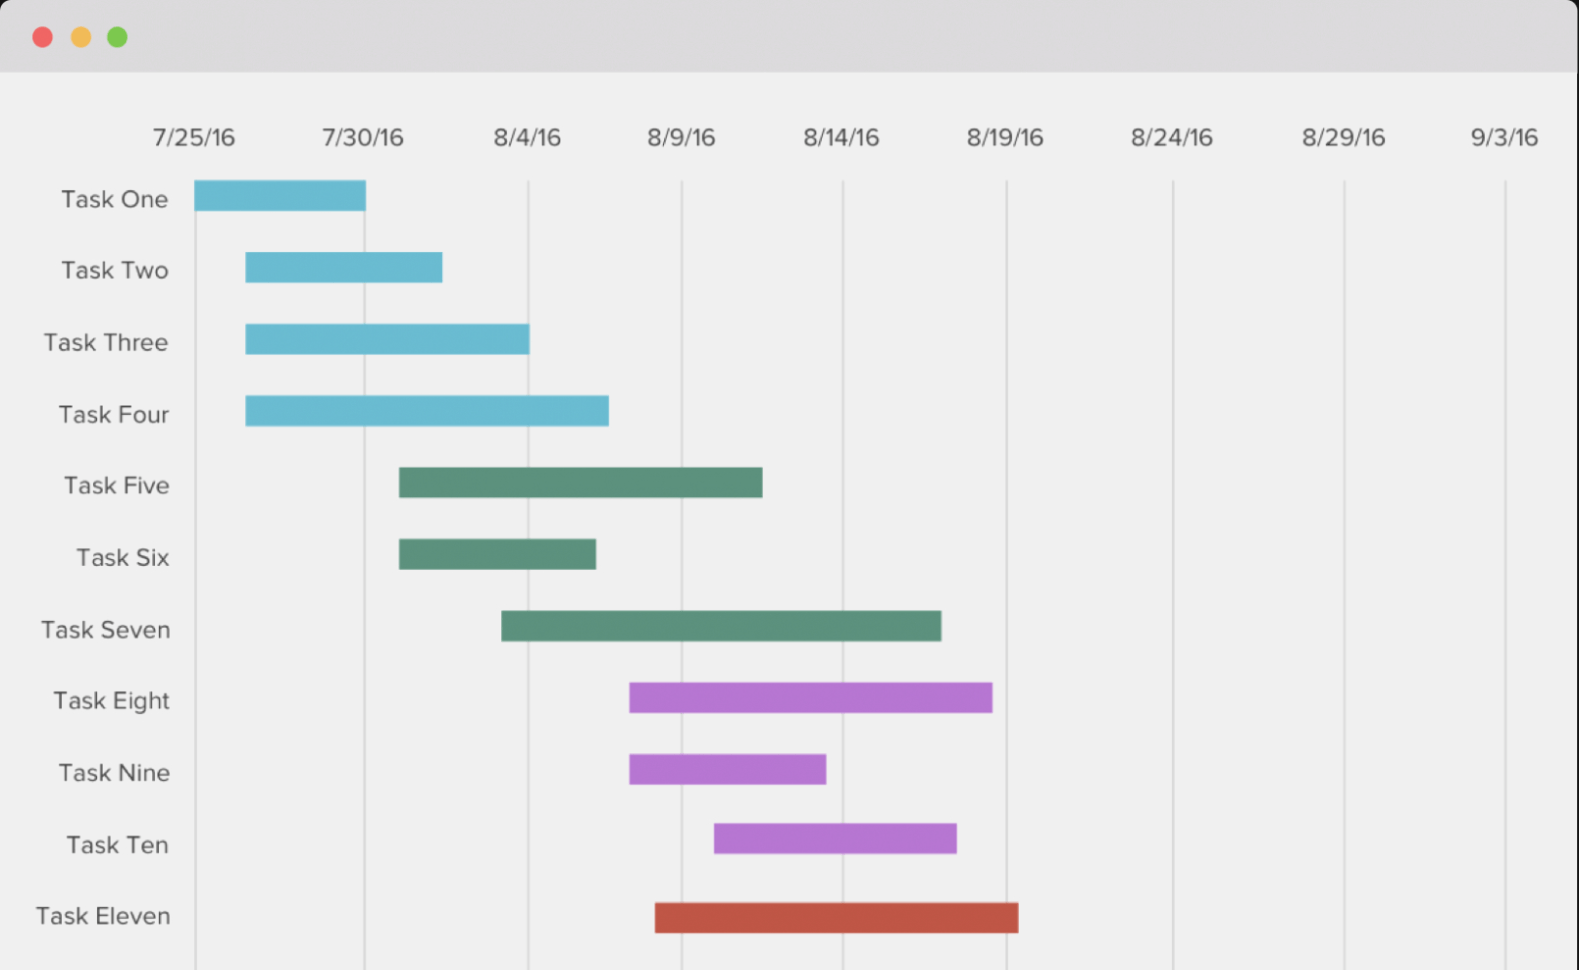 1579×970 excel gantt chart timeline good graphic chart from db-excel.com
 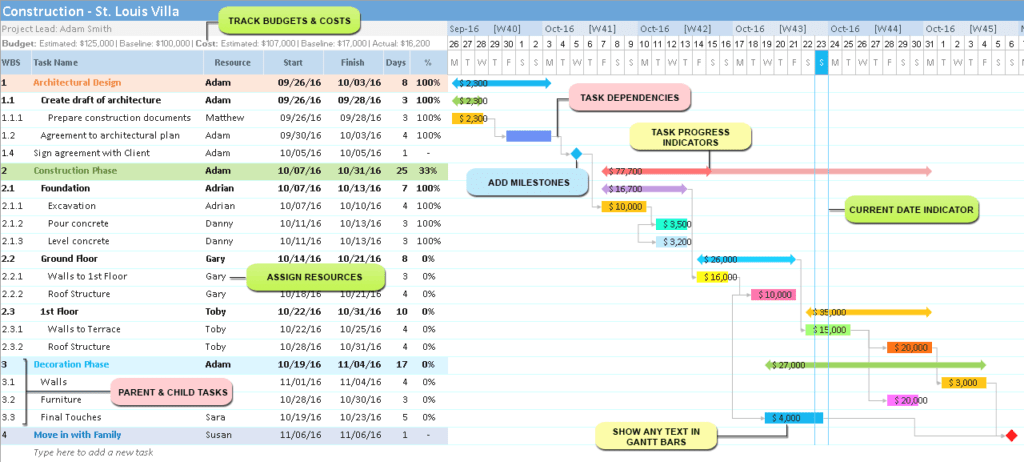 1024×462 gantt excel timeline gantt excel from ganttxl.com
  814×636 gantt chart timeline template excel from lesboucans.com
  817×1057 timeline gantt chart excel gratis from www.allbusinesstemplates.com
 Thank you for visiting Excel Gantt Chart Template With Timeline. There are a lot of beautiful templates out there, but it can be easy to feel like a lot of the best cost a ridiculous amount of money, require special design. And if at this time you are looking for information and ideas regarding the Excel Gantt Chart Template With Timeline then, you are in the perfect place. Get this Excel Gantt Chart Template With Timeline for free here. We hope this post Excel Gantt Chart Template With Timeline inspired you and help you what you are looking for.
Excel Gantt Chart Template With Timeline was posted in June 29, 2025 at 8:20 pm. If you wanna have it as yours, please click the Pictures and you will go to click right mouse then Save Image As and Click Save and download the Excel Gantt Chart Template With Timeline Picture.. Don’t forget to share this picture with others via Facebook, Twitter, Pinterest or other social medias! we do hope you'll get inspired by SampleTemplates123... Thanks again! If you have any DMCA issues on this post, please contact us!