Dynamic Gantt Chart Template With Pivot Table
Dynamic Gantt Chart Template with Pivot Table Integration
Project management thrives on clarity and adaptability. Traditional Gantt charts, while visually representing timelines, often fall short in handling complex project data and dynamic updates. Integrating a Gantt chart with a pivot table empowers project managers with a dynamic and insightful tool to track progress, analyze resource allocation, and make data-driven decisions.
Understanding the Core Components
This dynamic Gantt chart template hinges on two primary elements: the Gantt chart itself (visualization) and the pivot table (data aggregation and analysis). Let’s break down each component:
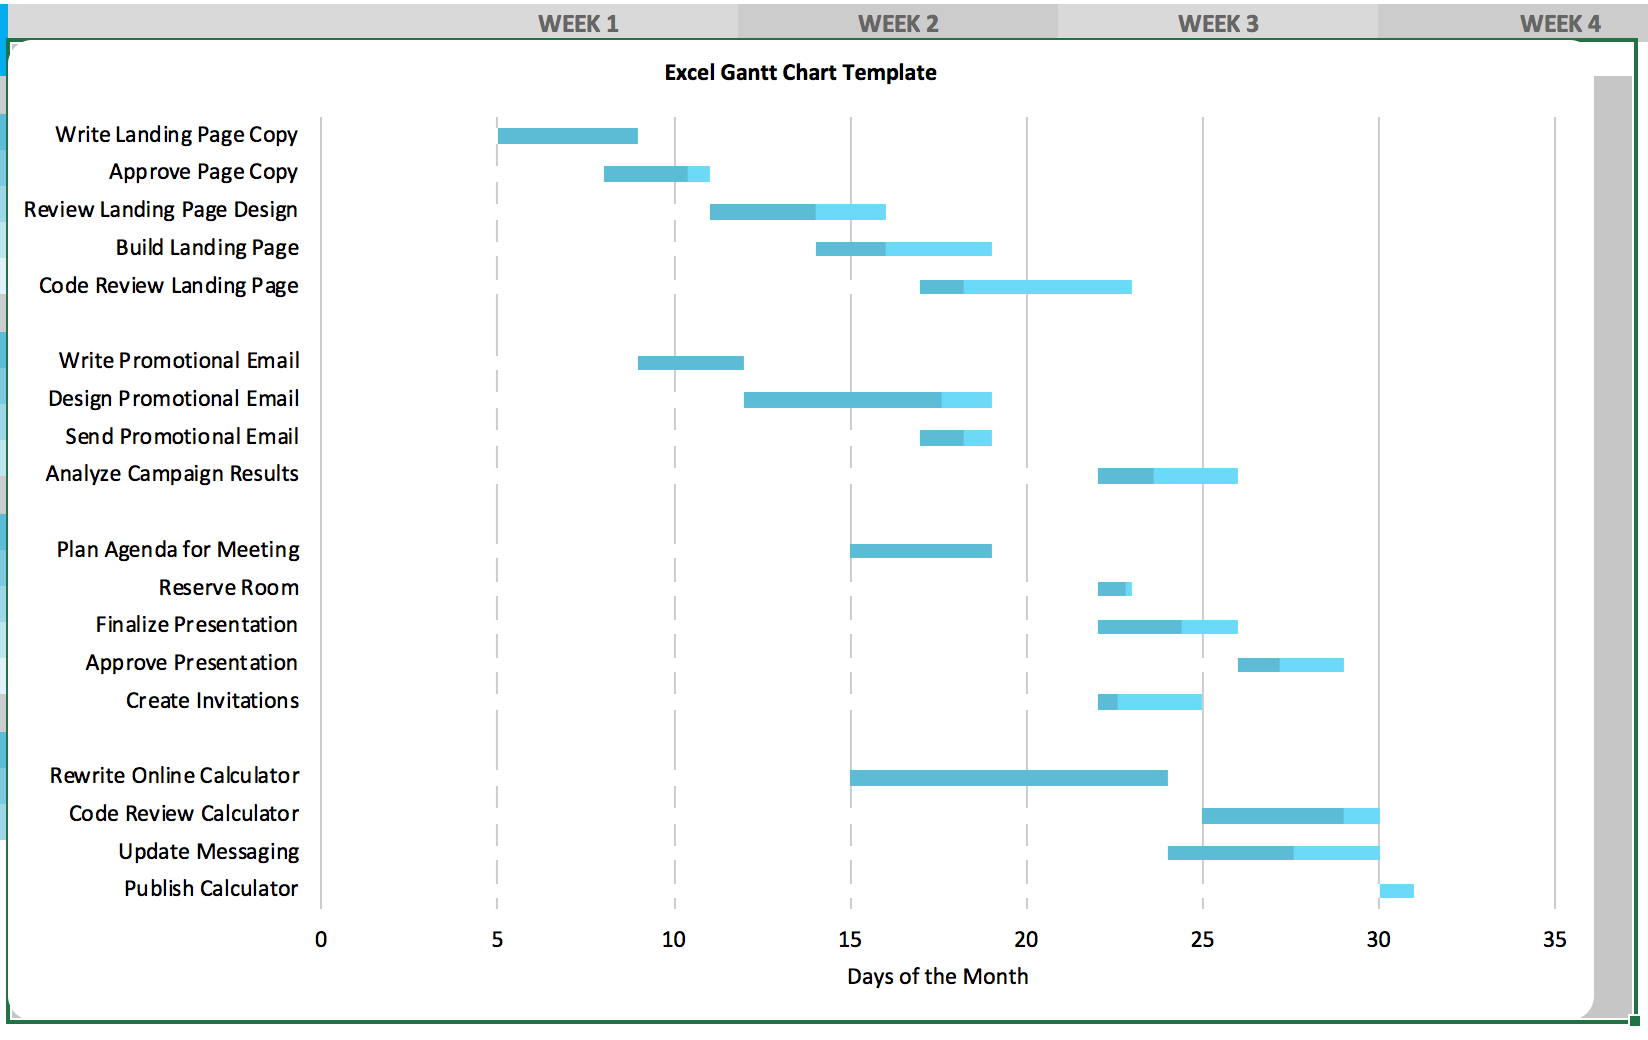
Gantt Chart: Visualizing the Timeline
The Gantt chart, at its essence, is a horizontal bar chart illustrating project schedules. Each task is represented by a bar, whose length corresponds to its duration. Key components include:
- Task Names: A clear description of each activity within the project.
- Start and End Dates: Defining the timeframe for each task.
- Dependencies: Relationships between tasks, indicating which activities must precede others.
- Progress: Visual representation of task completion (e.g., percentage complete).
- Resources: Assignment of personnel or equipment to specific tasks.
Pivot Table: Analyzing Project Data
A pivot table summarizes and aggregates data from a dataset, enabling users to extract meaningful insights. In this context, the pivot table will analyze project data related to tasks, resources, and timelines. Key functionalities include:
- Data Aggregation: Summarizing task durations, resource utilization, and completion rates.
- Filtering and Sorting: Isolating specific tasks, resources, or time periods for analysis.
- Grouping: Categorizing tasks by phase, department, or priority.
- Calculated Fields: Creating custom metrics, such as variance between planned and actual durations.
Building the Dynamic Template
Here’s a step-by-step approach to constructing the dynamic Gantt chart template using a spreadsheet program like Microsoft Excel or Google Sheets:
- Data Input: Begin by creating a data table containing all relevant project information. This table should include columns for:
- Task ID (Unique identifier for each task)
- Task Name
- Start Date
- End Date
- Duration (Calculated: End Date – Start Date + 1)
- Dependencies (Task ID of the preceding task, if any)
- Assigned Resource(s)
- Priority (High, Medium, Low)
- Status (Not Started, In Progress, Completed)
- % Complete
- Gantt Chart Creation: Utilize the spreadsheet program’s chart feature to create a stacked bar chart. The initial bars should represent the “Start Date”. The second set of bars, stacked on top, will represent the “Duration”. The trick is to format the “Start Date” bars to have no fill (invisible) so only the “Duration” bars are visible, creating the Gantt chart effect. Adjust the chart’s axes to display dates appropriately. Add data labels or tooltips to display task names and other relevant information.
- Pivot Table Creation: Select the data table created in step 1 and create a pivot table. Experiment with different row and column arrangements to analyze the data from various perspectives. For example:
- Rows: Assigned Resource, Columns: Status, Values: Count of Task IDs (to see how many tasks each resource has in each status).
- Rows: Priority, Columns: % Complete (grouped into ranges), Values: Average Duration (to see if higher priority tasks are completed faster).
- Dynamic Updates: The key to a dynamic template is linking the Gantt chart and pivot table to the data table. When you update the data table (e.g., change a task’s end date, assign a new resource), the Gantt chart and pivot table will automatically reflect these changes. In Excel, this happens automatically when you refresh the Pivot Table. In Google Sheets, the Pivot Table refreshes on edit. The Gantt chart, based directly on the data, updates instantly.
- Conditional Formatting: Enhance the visual appeal and information density of the Gantt chart using conditional formatting. For example:
- Color-code tasks based on their priority (e.g., red for high, yellow for medium, green for low).
- Visually highlight tasks that are overdue (based on comparing the current date to the end date).
- Use data bars to visually represent the “% Complete” within each task’s bar.
- Adding Slicers/Filters (Pivot Table): Insert slicers linked to the pivot table to enable interactive filtering. Slicers allow users to quickly narrow down the data displayed based on specific criteria (e.g., filtering by resource, priority, or status). The Gantt chart itself won’t be directly affected by the slicers (as it’s based on the raw data table), but the insights derived from the filtered Pivot Table can inform adjustments to the Gantt chart’s data.
- Calculated Columns: Add calculated columns to your data table to derive valuable insights. Examples include:
- “Days Remaining”: Calculate the number of days remaining until a task’s deadline (End Date – Today).
- “Variance”: Calculate the difference between the planned duration and the actual duration (if you have an “Actual End Date” column).
- Milestones: Designate key milestones within your project by creating tasks with zero duration (or a very short duration). Visually represent these milestones on the Gantt chart with a distinctive marker (e.g., a diamond shape).
Benefits of a Dynamic Gantt Chart with Pivot Table
Integrating a Gantt chart with a pivot table offers significant advantages over static project management tools:
- Real-Time Updates: Changes to project data are immediately reflected in both the Gantt chart and pivot table, providing an up-to-date view of project status.
- Improved Data Analysis: The pivot table enables in-depth analysis of project data, revealing trends and potential issues that might be missed in a static Gantt chart.
- Enhanced Decision-Making: Data-driven insights from the pivot table empower project managers to make informed decisions about resource allocation, task prioritization, and risk mitigation.
- Increased Collaboration: A shared, dynamic template fosters collaboration among team members, ensuring everyone is aware of the project’s progress and their individual responsibilities.
- Better Resource Management: Easily identify over-allocated or under-allocated resources to optimize resource utilization.
- Proactive Risk Management: Identify potential bottlenecks or delays early on, allowing for proactive intervention.
Conclusion
A dynamic Gantt chart template with integrated pivot table is a powerful tool for modern project management. By combining visual timelines with data analysis capabilities, project managers can gain a comprehensive understanding of their projects, track progress effectively, and make informed decisions to ensure successful project outcomes. The ability to adapt and update in real-time makes this template invaluable in managing projects of any complexity.
 1648×1040 gantt chart excel template teamgantt excel from db-excel.com
  1280×720 editable powerpoint gantt chart template slidemodel from slidemodel.com
  900×572 gantt chart issue power pivot excel forum from www.myonlinetraininghub.com
  663×586 create gantt chart pivot table page qlik from community.qlik.com
 Thank you for visiting Dynamic Gantt Chart Template With Pivot Table. There are a lot of beautiful templates out there, but it can be easy to feel like a lot of the best cost a ridiculous amount of money, require special design. And if at this time you are looking for information and ideas regarding the Dynamic Gantt Chart Template With Pivot Table then, you are in the perfect place. Get this Dynamic Gantt Chart Template With Pivot Table for free here. We hope this post Dynamic Gantt Chart Template With Pivot Table inspired you and help you what you are looking for.
Dynamic Gantt Chart Template With Pivot Table was posted in October 24, 2025 at 8:17 am. If you wanna have it as yours, please click the Pictures and you will go to click right mouse then Save Image As and Click Save and download the Dynamic Gantt Chart Template With Pivot Table Picture.. Don’t forget to share this picture with others via Facebook, Twitter, Pinterest or other social medias! we do hope you'll get inspired by SampleTemplates123... Thanks again! If you have any DMCA issues on this post, please contact us!